View and Manage Reports
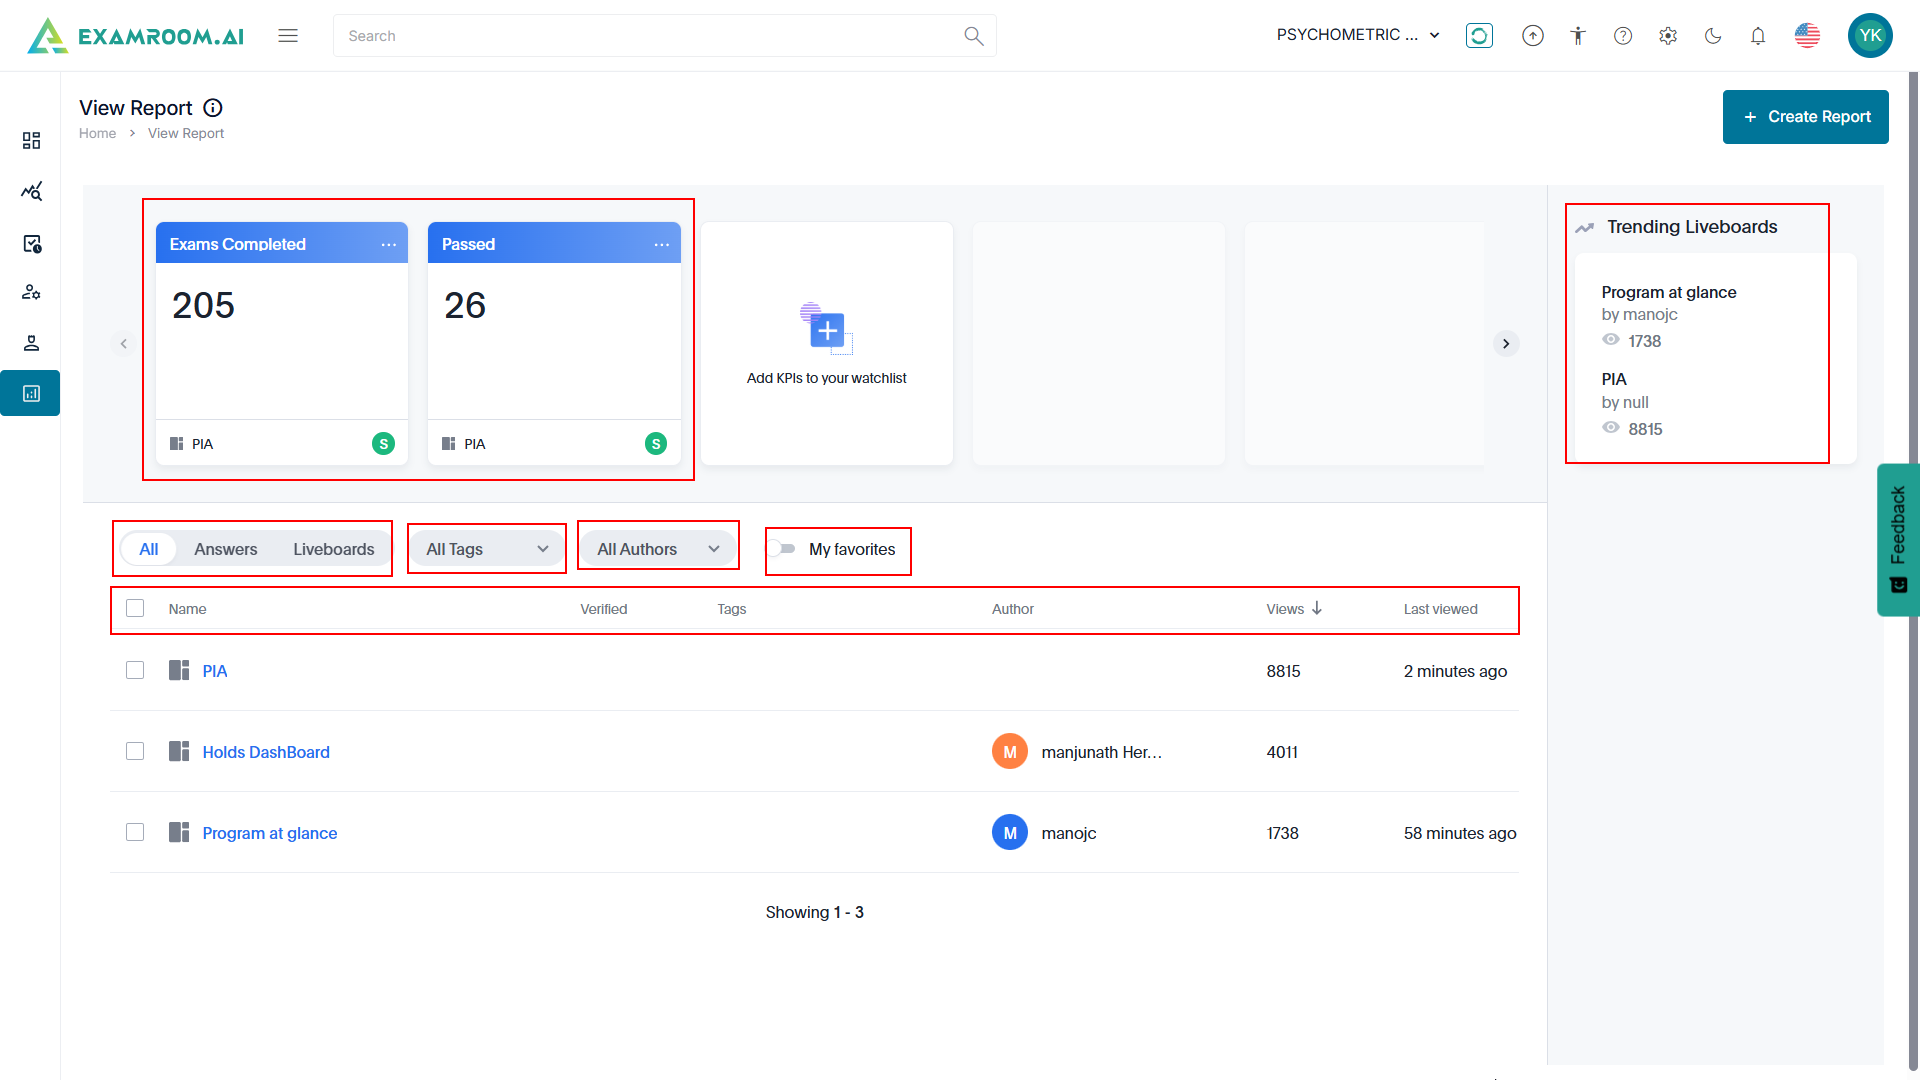
The Reports section provides comprehensive information and various customizable reports on all data for review and analysis.
To navigate to the report section, follow the steps below:
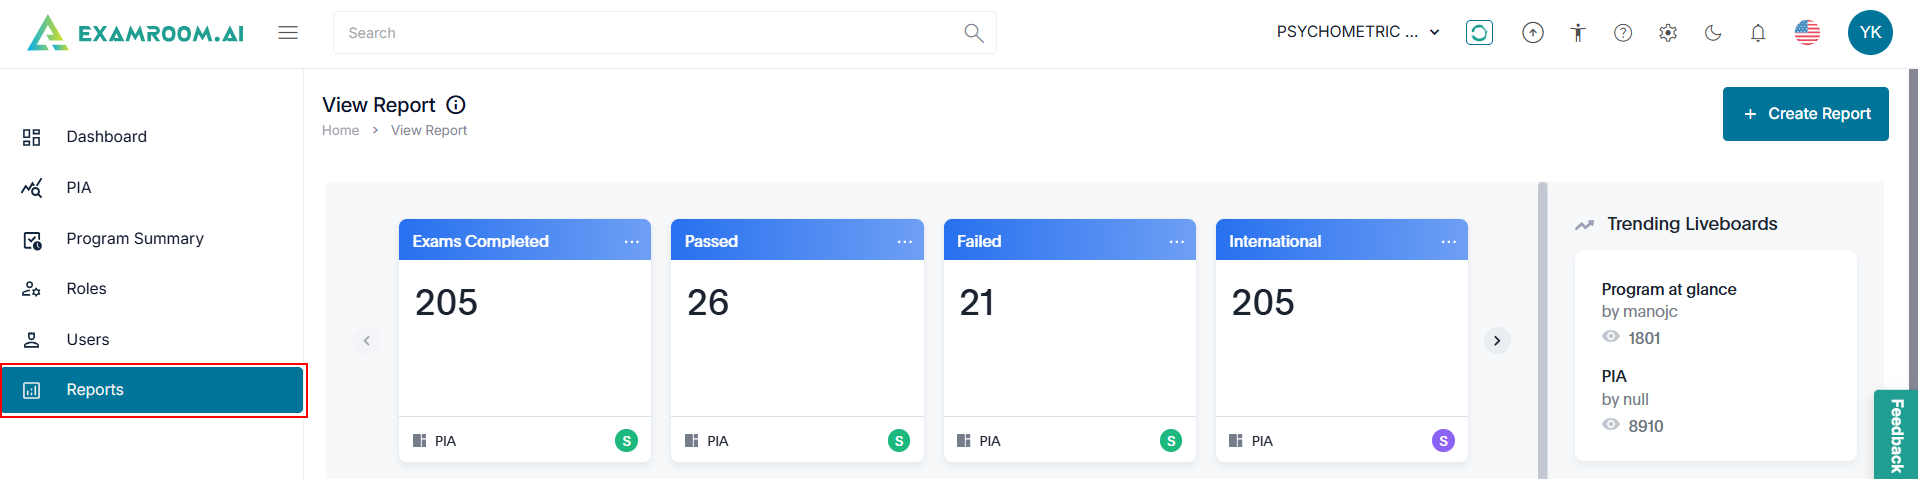
- Click Reports from the left navigation menu.
- View the KPIs that you have added to your watchlist.
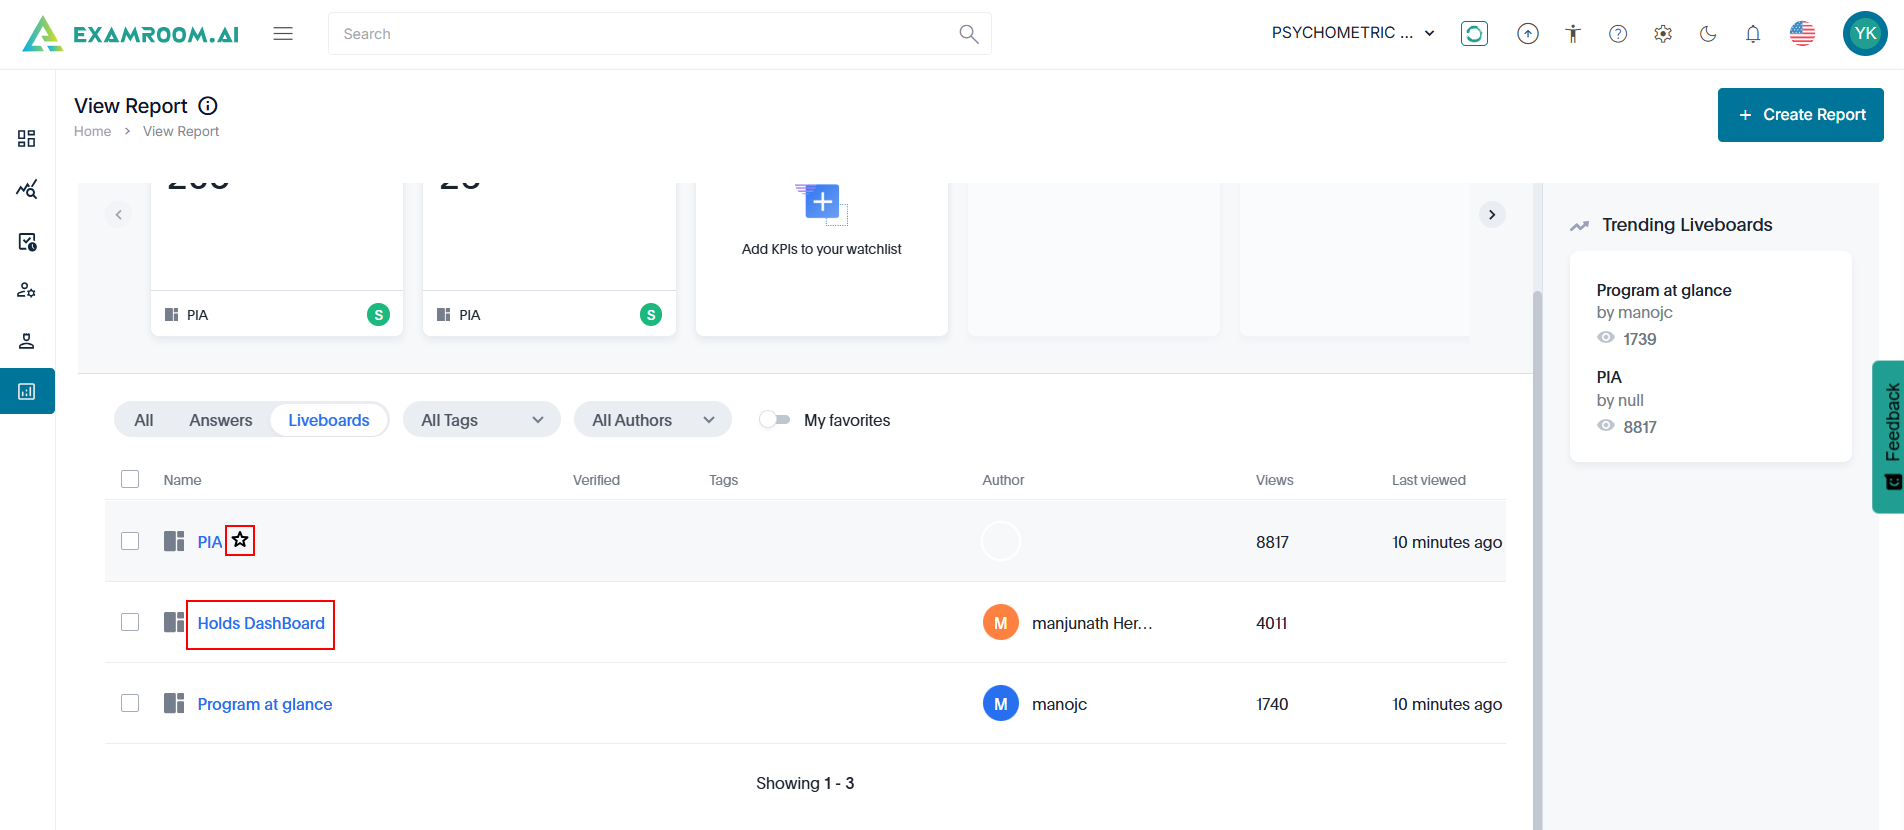
- Trending Liveboards display the most popular or frequently accessed Liveboards, highlighting key insights and data trends.
- All, Answers, Liveboards, All tags, and All Authors help filter and organize search results based on specific criteria for more efficient data exploration.
- The table headers are as follows:
- Name: The title or identifier of the report.
- Verified: Indicates whether the report has been validated.
- Tags: Keywords or labels associated with the report.
- Author: The creator or contributor of the report.
- Views: The number of times the report has been accessed.
- Last Viewed: The most recent date the report was accessed.
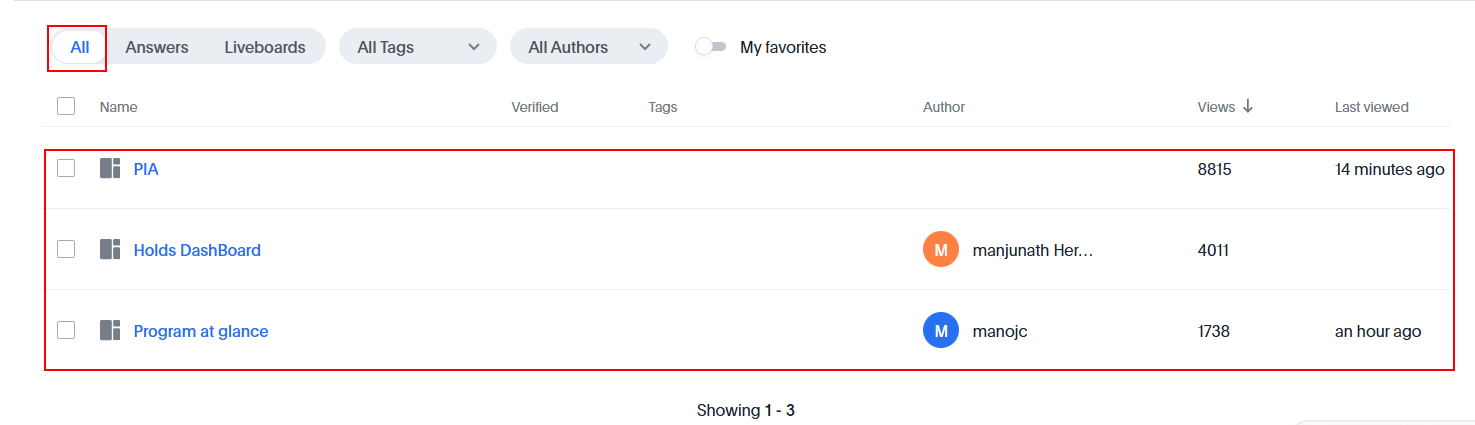
- Click All to view all available data, including answers, Liveboards, and other content, without applying filters.
- Click Answer to view search results based on specific criteria or attributes of the answers.
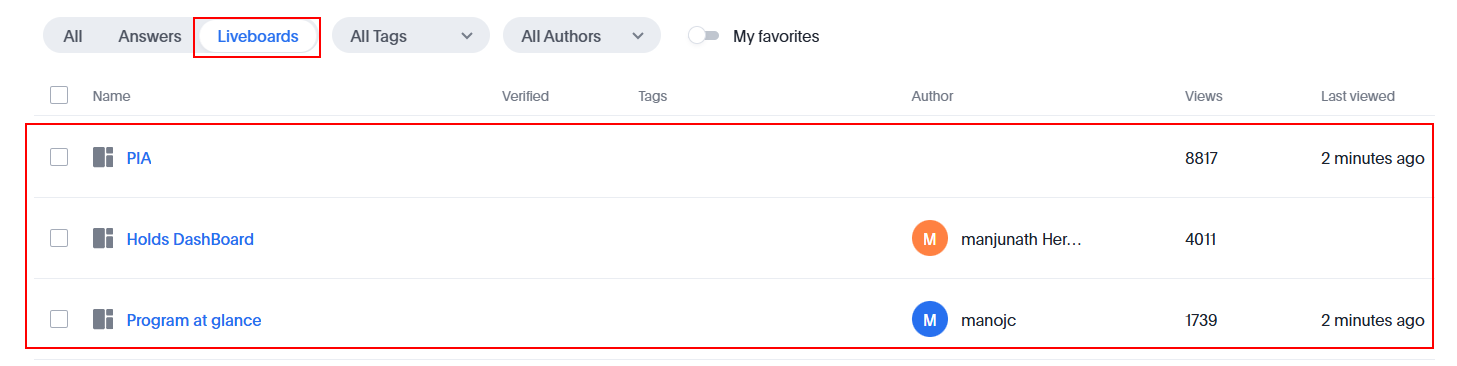
- Click Liveboards to narrow down and customize the displayed liveboards based on specific criteria, helping to focus on the most relevant visualizations and insights.
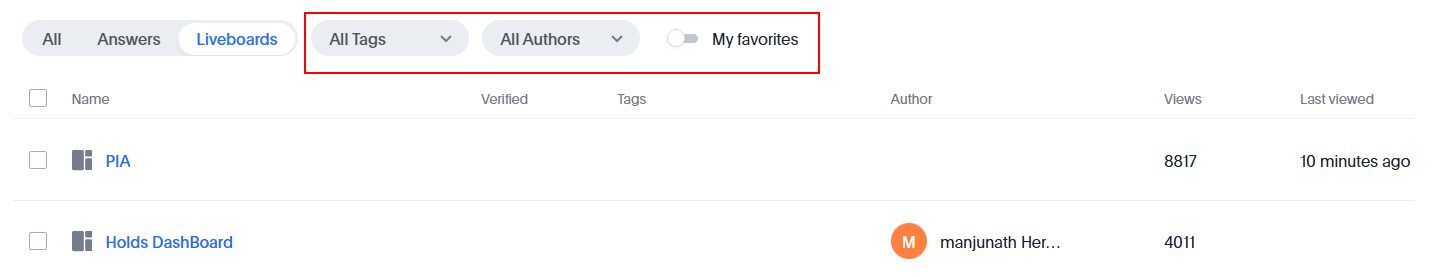
- Select All Tags from the dropdown to filter the list using all available tags associated with data.
- Select All Authors from the dropdown to filter the list using the authors.
- Click My Favorites button to view only the items marked as favorites for easy access.
- Click the
icon to add the liveboard to your favorite list.
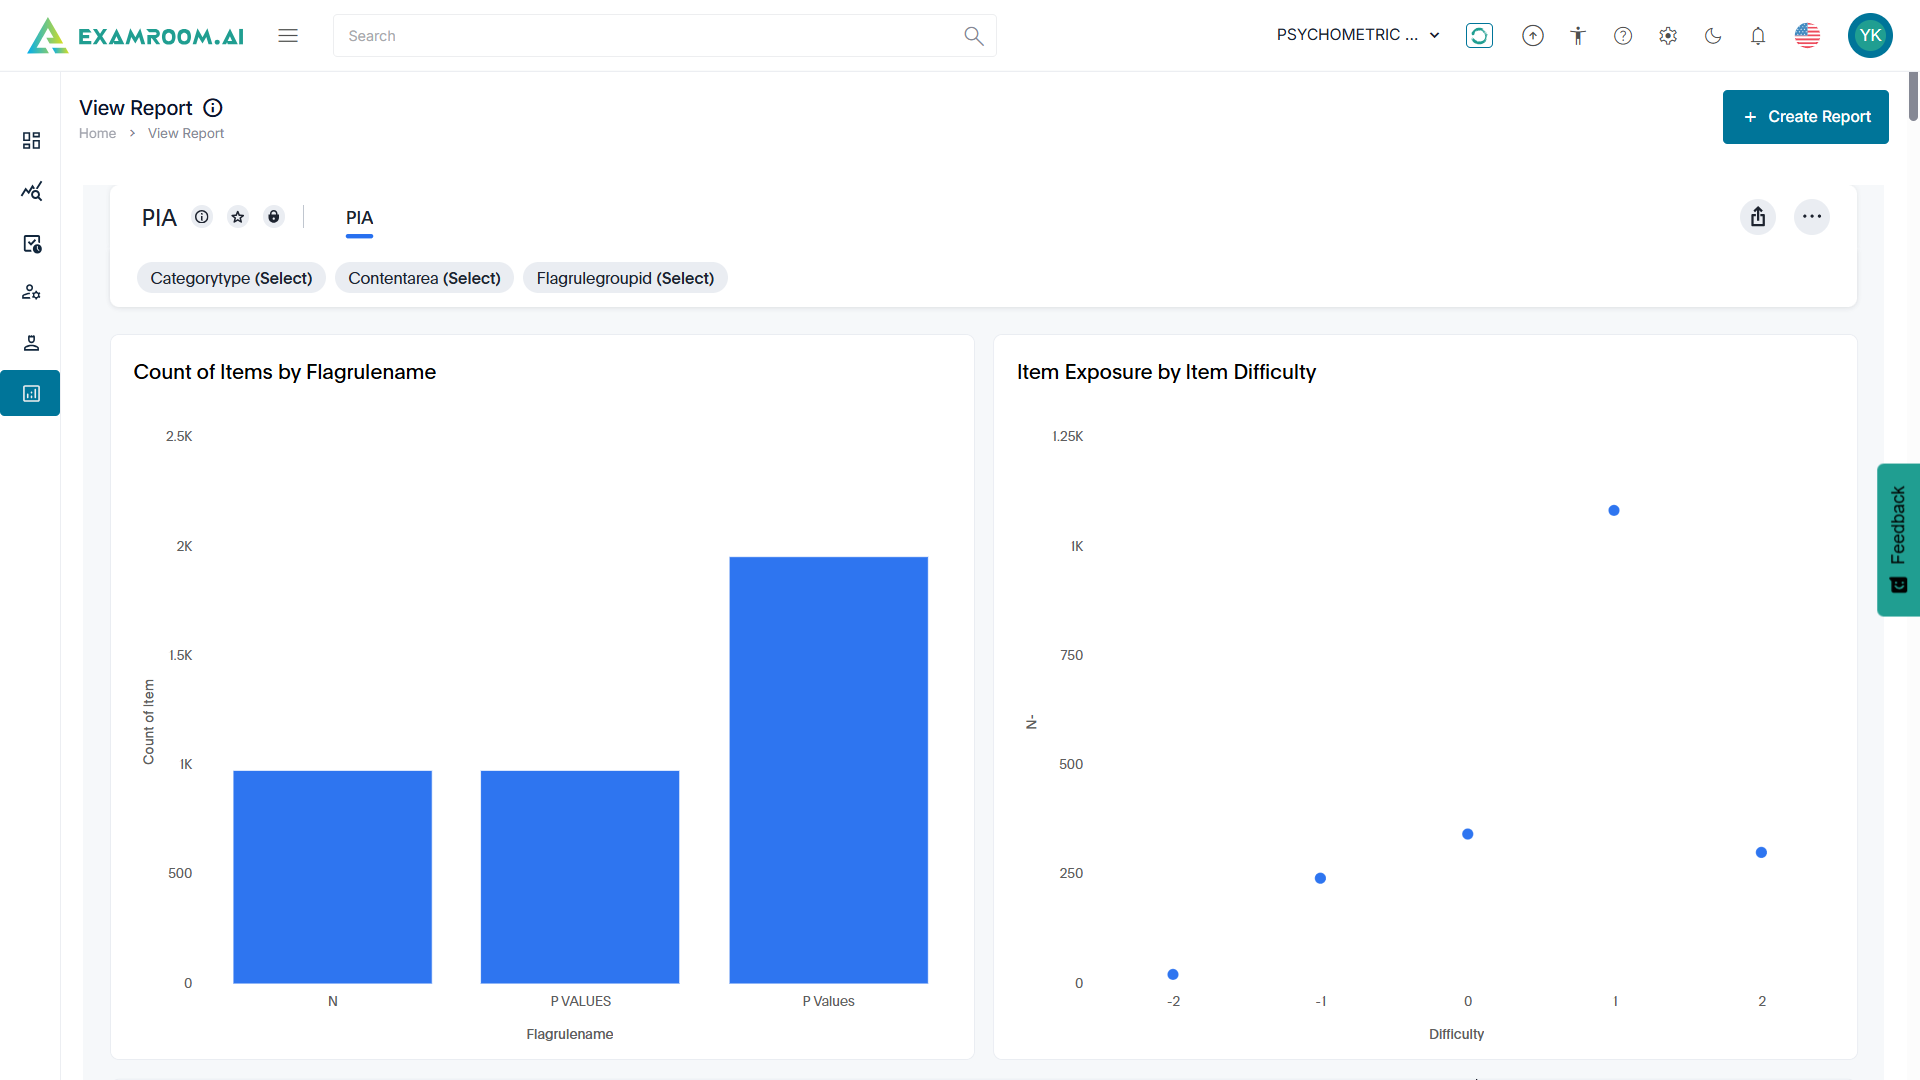
- In the Name column, click the Liveboard hyperlink.
- View a preview of the liveboard.


Add KPI to watchlist
Tracking important KPIs refers to monitoring key performance indicators (KPIs) through interactive dashboards and visualizations to gain insights and make data-driven decisions.
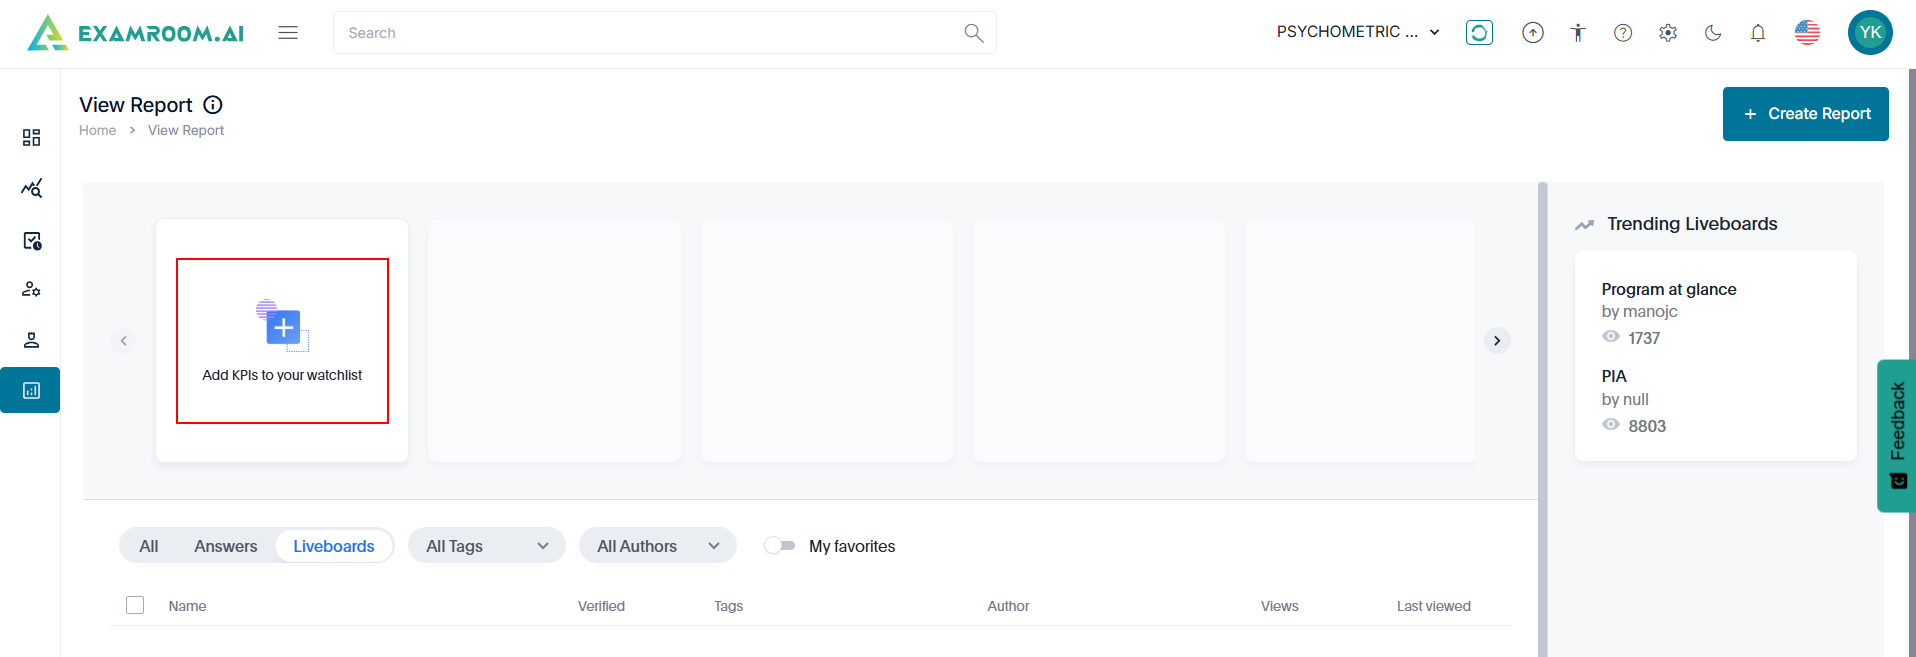
- Click Reports from the left navigation menu.
- Click Add KPI to your watchlist.
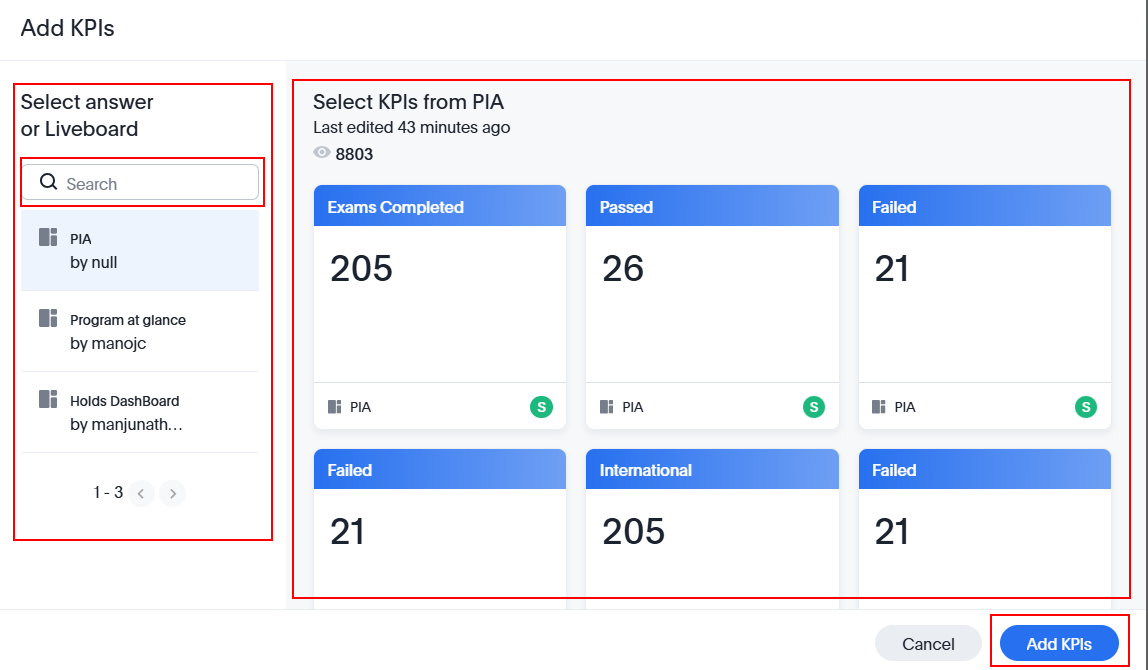
- Use the Search bar to find the answer or Liveboard.
Note: Answer is a dynamic visualization or data result generated from a search query. - Select the answer or Liveboard from the list.
- Select KPIs from the PIA.
- Click Add KPIs to include them in the watchlist or click Cancel to exit without saving.
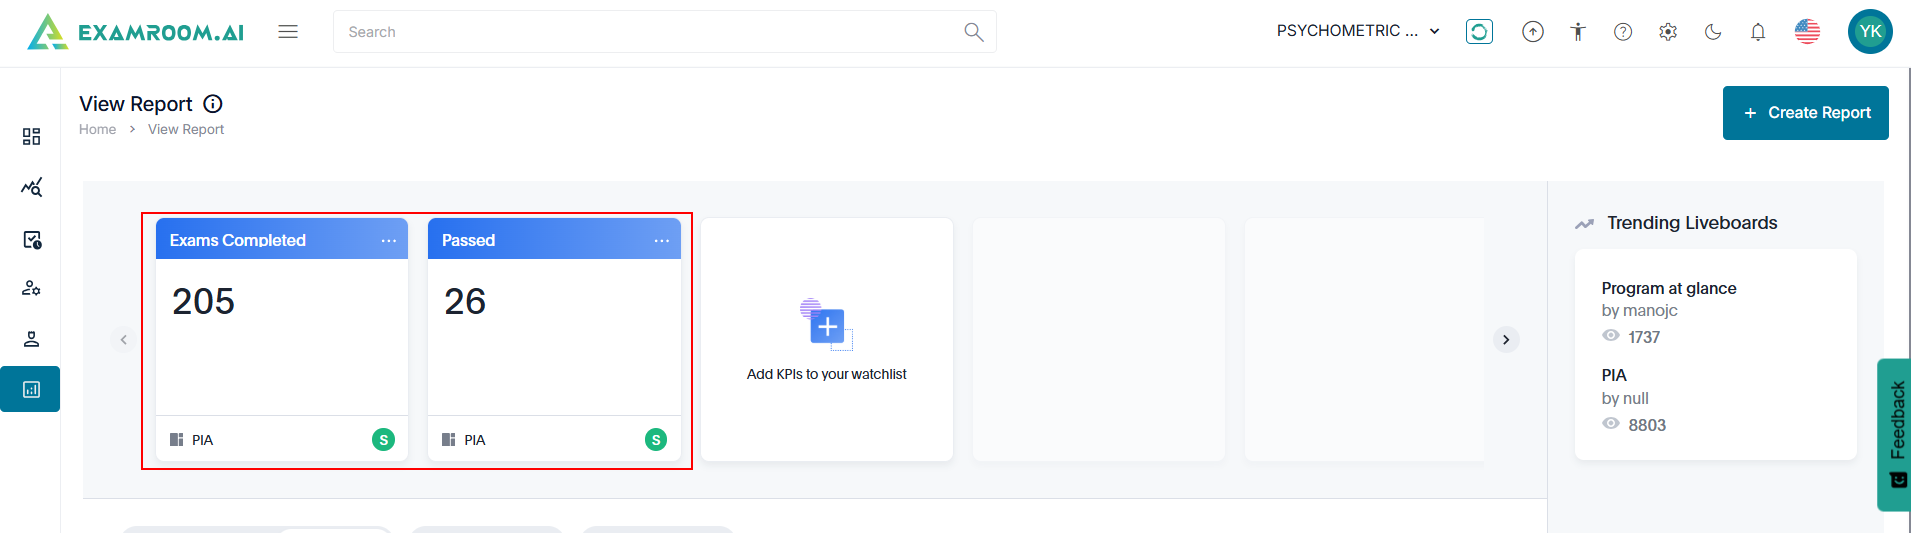
- View the added KPIs in the watchlist section.