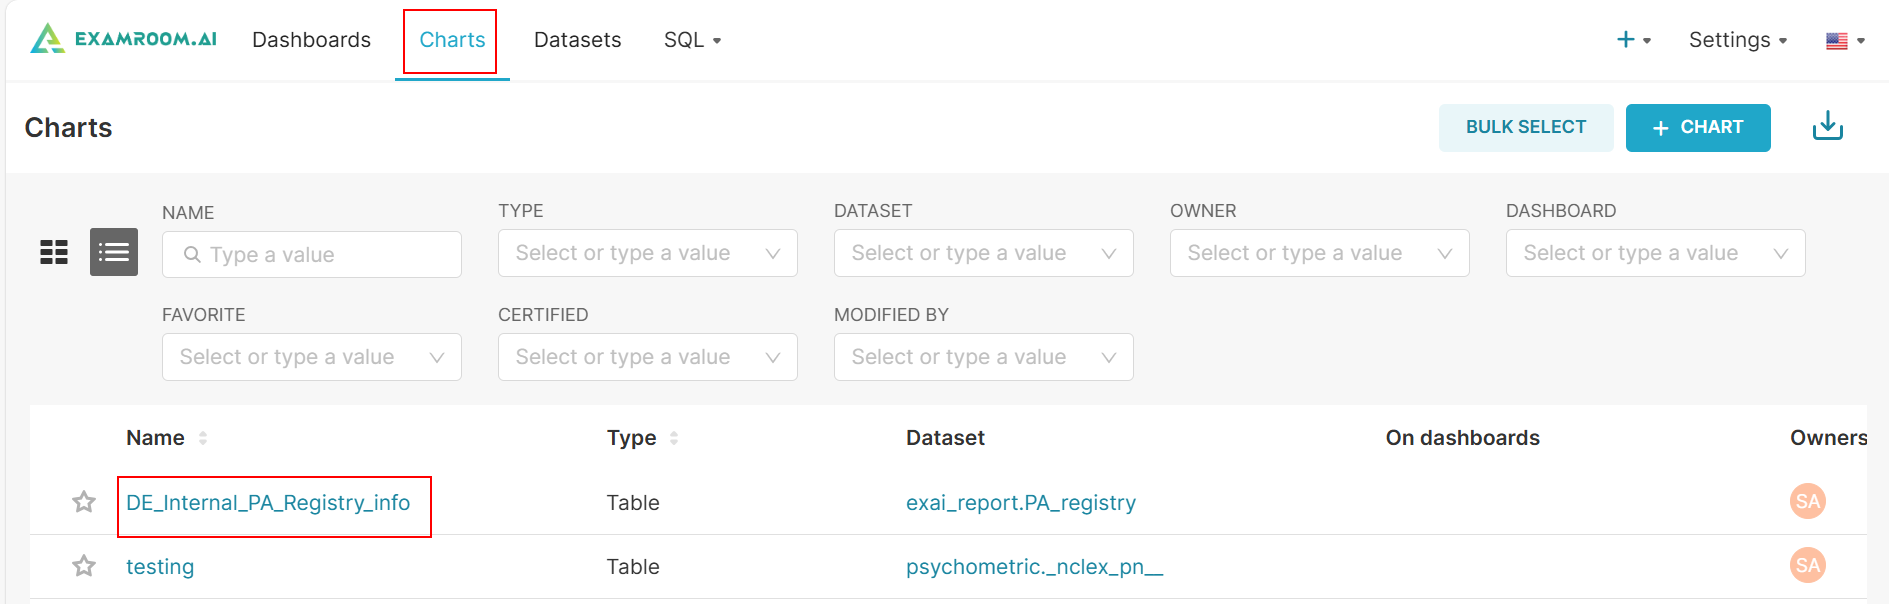
View and Manage Charts
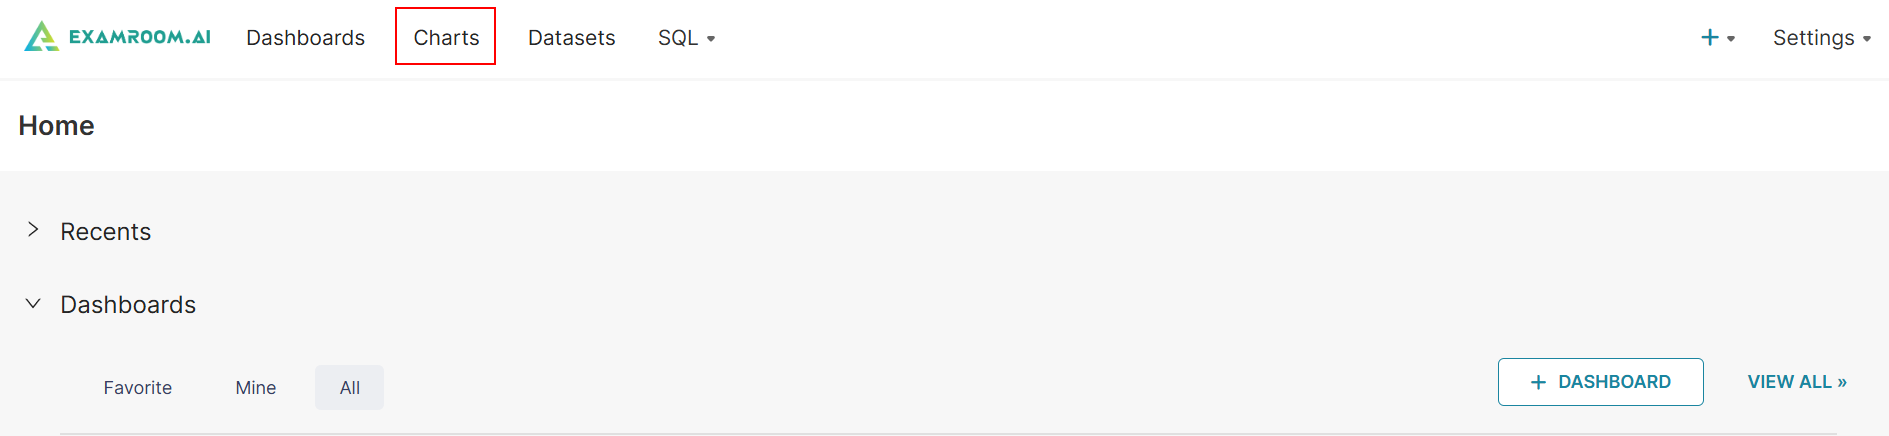
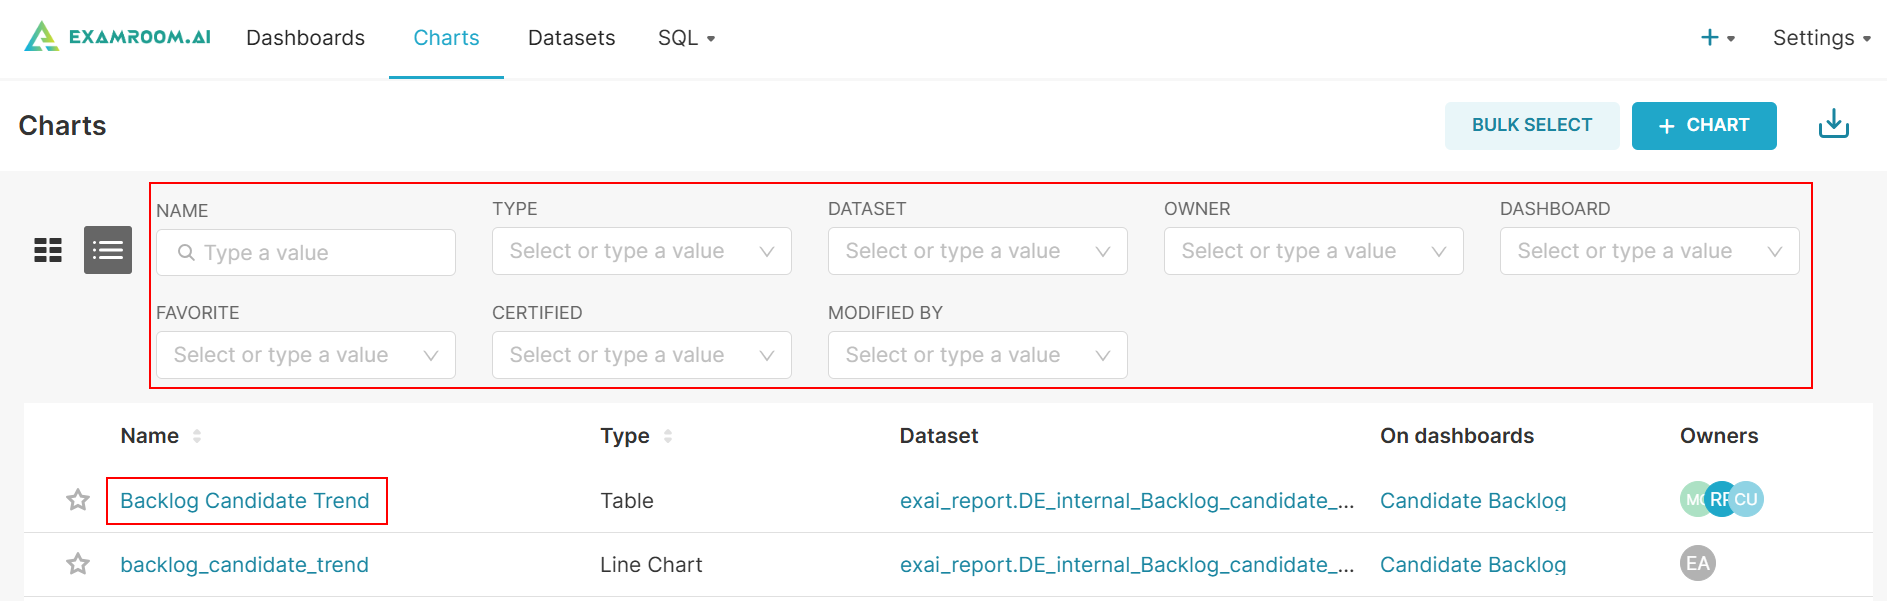
- Click Charts on the toolbar.
- Search or filter the list by entering the Name, or by selecting the Type, Dataset, Owner, Dashboard, Favorite, Certified, or Modified By.
- Name: Displays the chart's title or identifier.
- Type: Specifies the chart's visualization type
- Dataset: Indicates the dataset used to generate the chart.
- Owners: Lists of the users who have ownership of the chart.
- Dashboard: Shows the dashboard the chart is associated with.
- Favorite: Marks the chart as a favorite for easy access.
- Certified: Indicates whether the chart has been certified.
- Modified By: Displays the user who last modified the chart.
- Click the exam hyperlink in the Name column to view the Chart section.
- To manage the chart, please refer to the following fields and icons:
icon adds or removes charts from your favorites.
to preview the list of dashboards in the chart settings dropdown.
icon to view the ExamIQ Admin details.
icon to view Last modified and Modified by details.
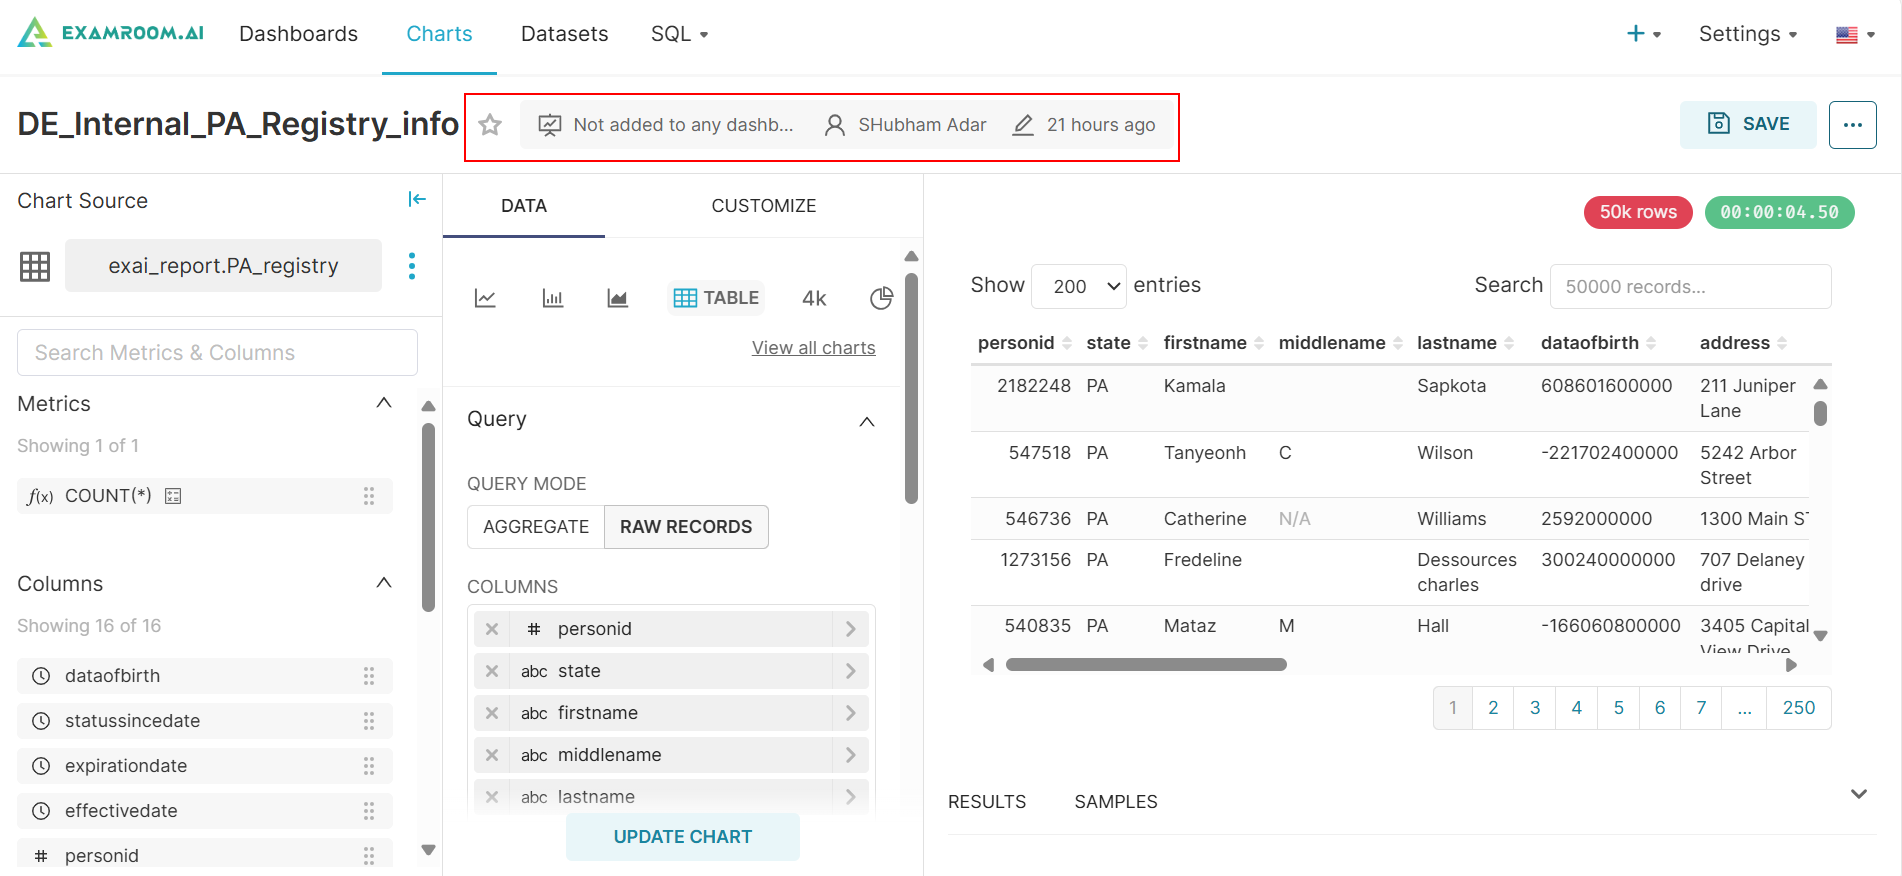
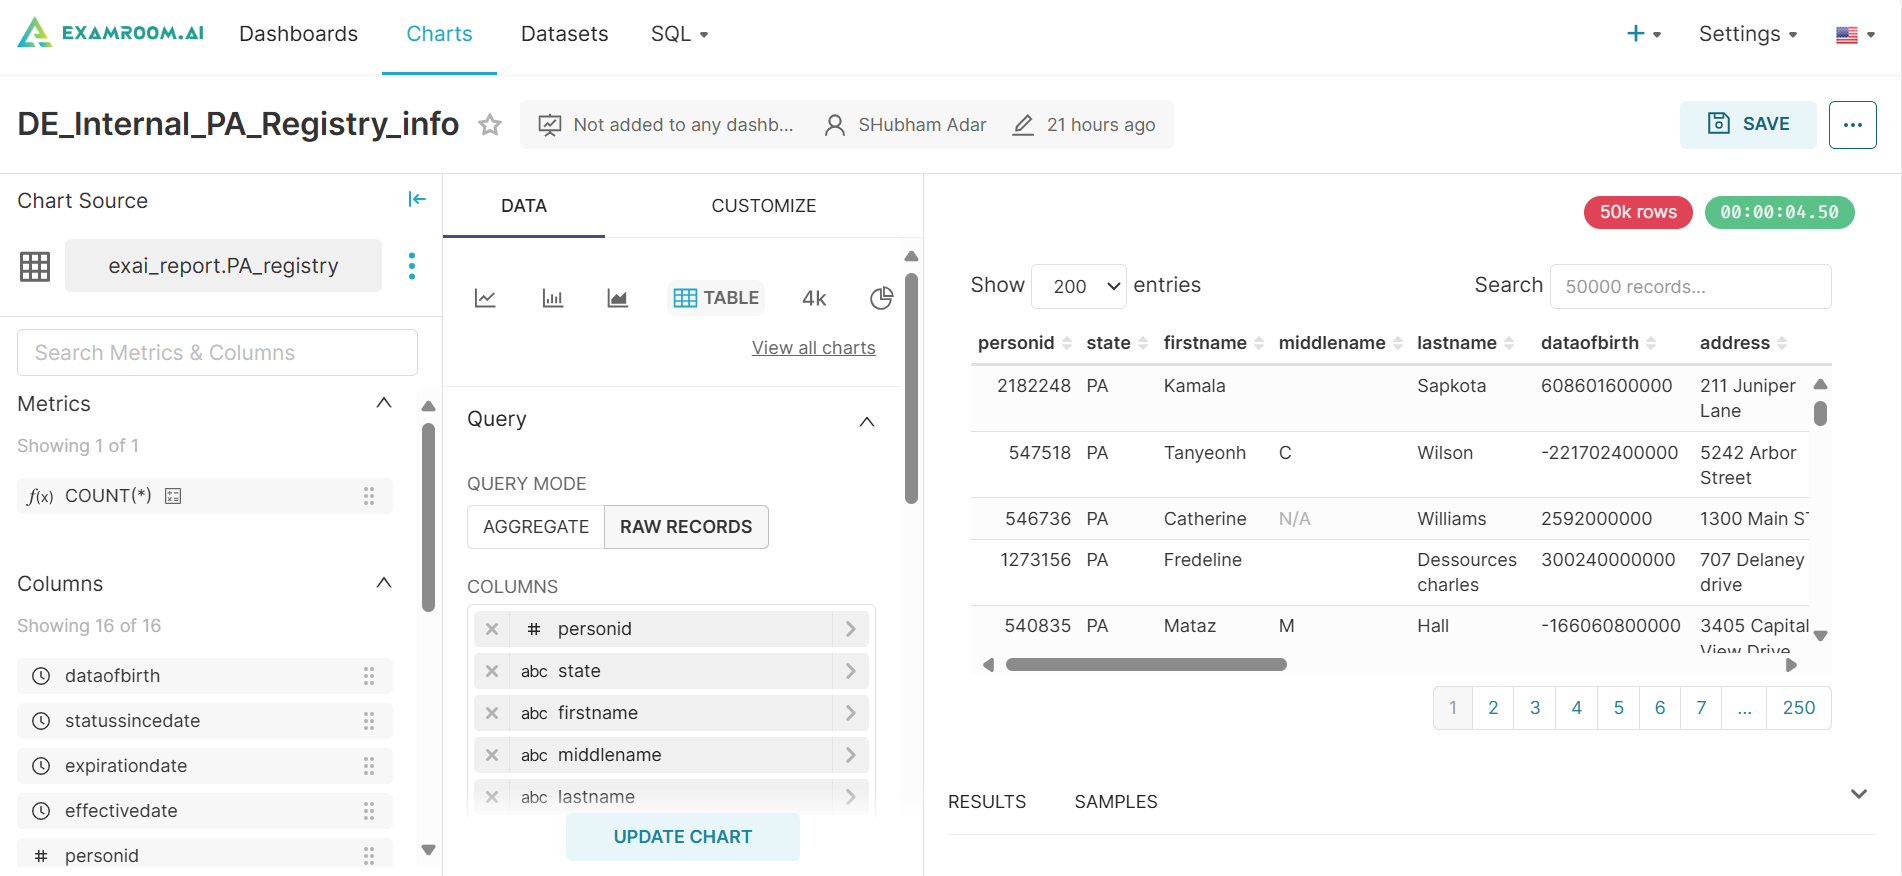
- Click the
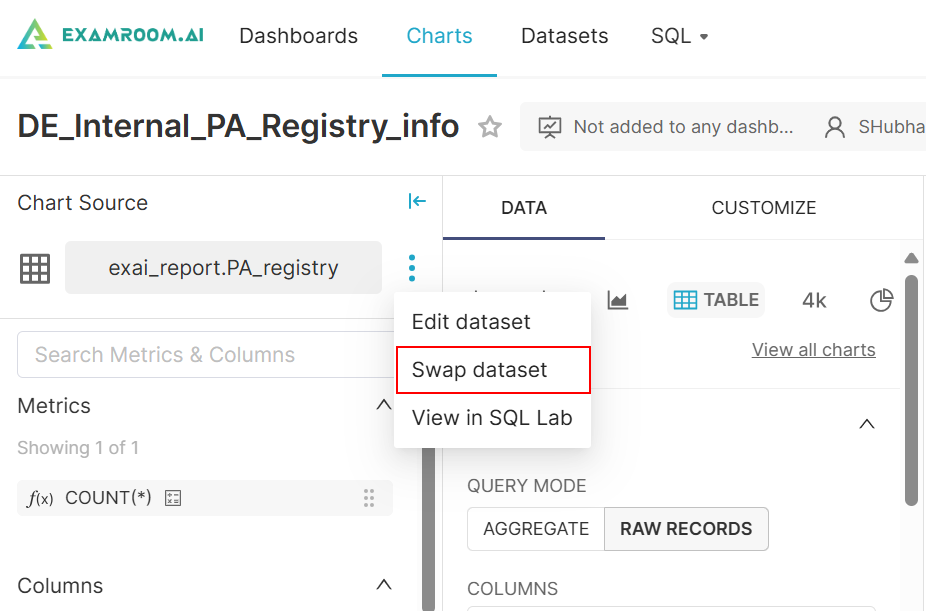
icon under Chart Source to Edit dataset, Swap dataset, and View in SQL Lab.
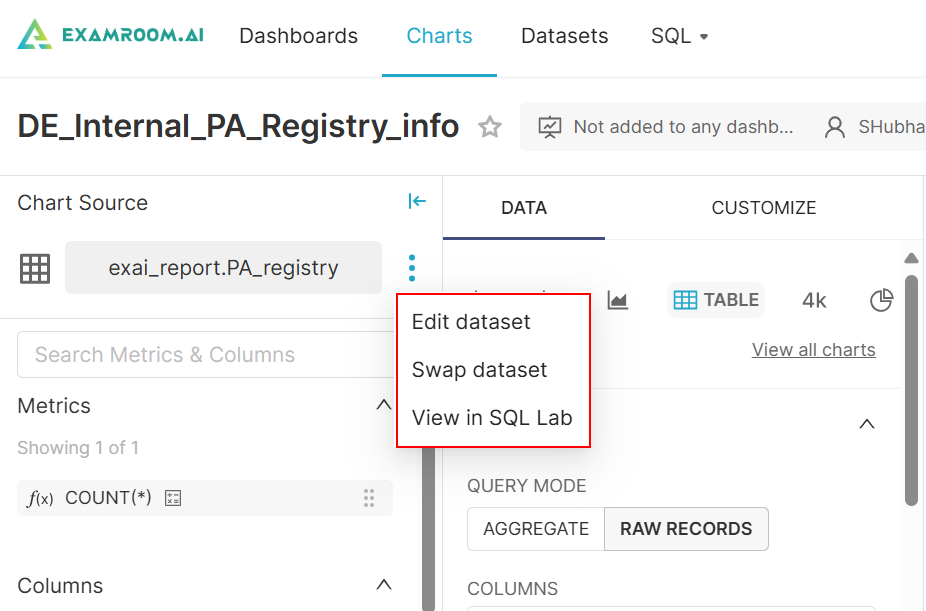
Edit dataset
- Click Edit dataset from the Chart Source page to edit the Source, Metrics, Columns, Calculated Columns, and Settings.
Note: Changing these settings will affect all charts using this dataset, including charts owned by other users.
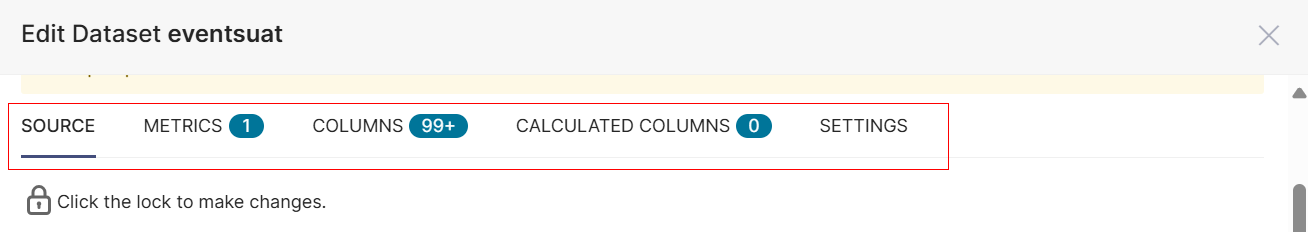
SOURCE
- Click the SOURCE tab.
- Click the padlock icon to make changes.
Note: Once you click the padlock icon, you can edit the remaining details; otherwise, it will be grayed out. - Click Physical for table view, or Virtual for SQL format.
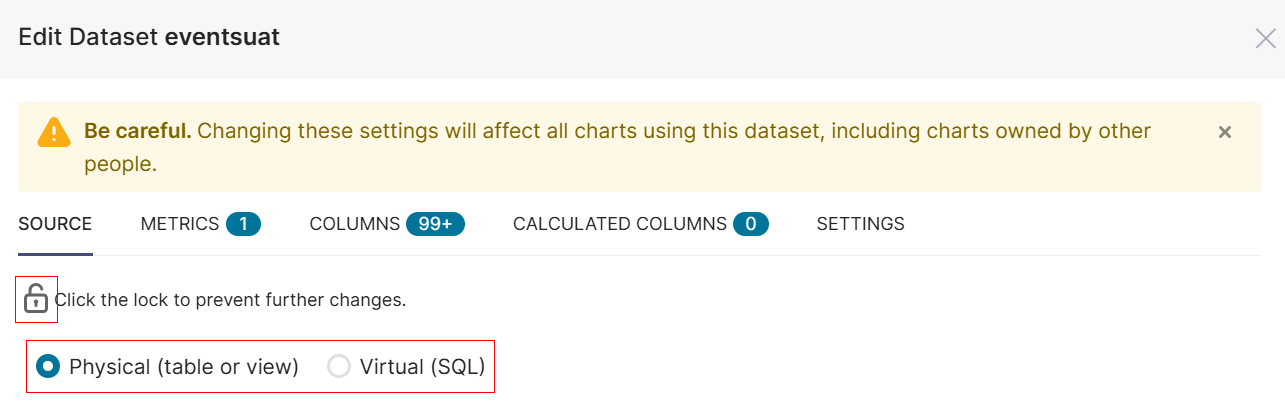
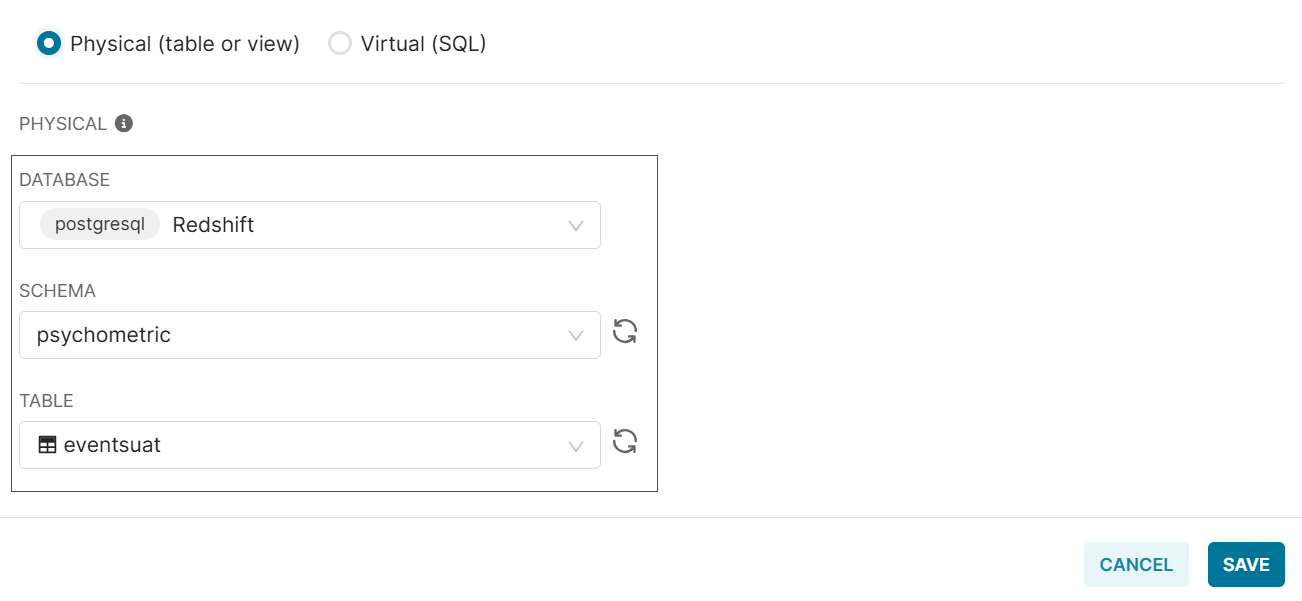
Physical:
- Select the Database, Schema, and Table from the dropdown list.
Note: Once you select a database, the corresponding schema will be displayed. You can then view the tables listed within that schema.
- Click Save to save the dataset. Otherwise, click Cancel to exit without saving.
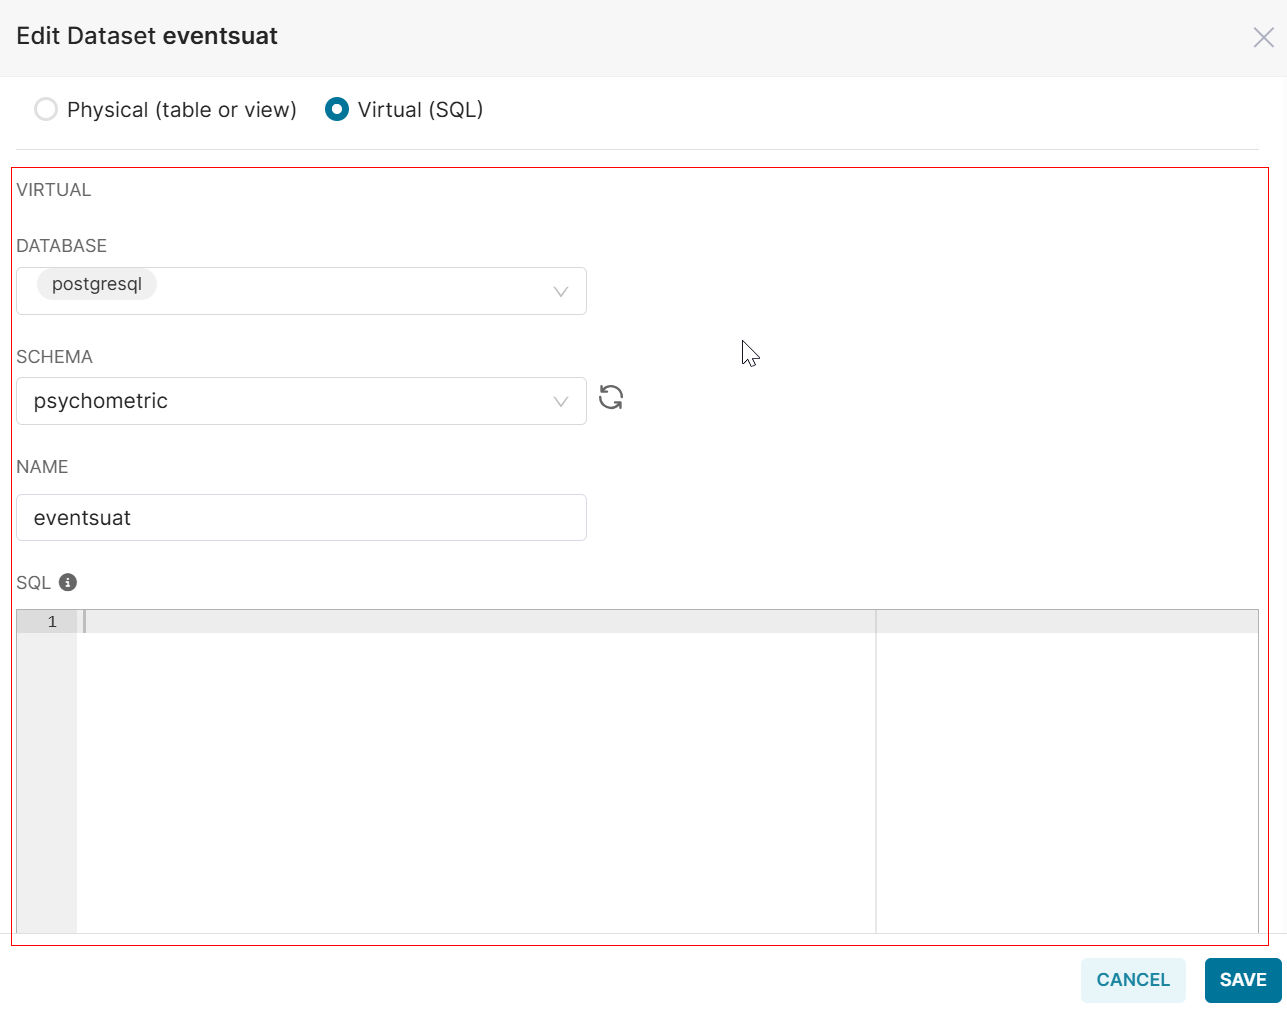
Virtual:
- Select the Database, Schema, and Name from the dropdown menu.
Note: Once you select a database, the corresponding schema will be displayed. You can then view the tables listed within that schema. - View the SQL based on the data source.
Note: When specifying SQL, the data source acts as a view. The ExamIQ will use this statement as a subquery while grouping and filtering on the generated parent queries.
- Click Save to save the dataset. Otherwise, click Cancel to exit without saving.
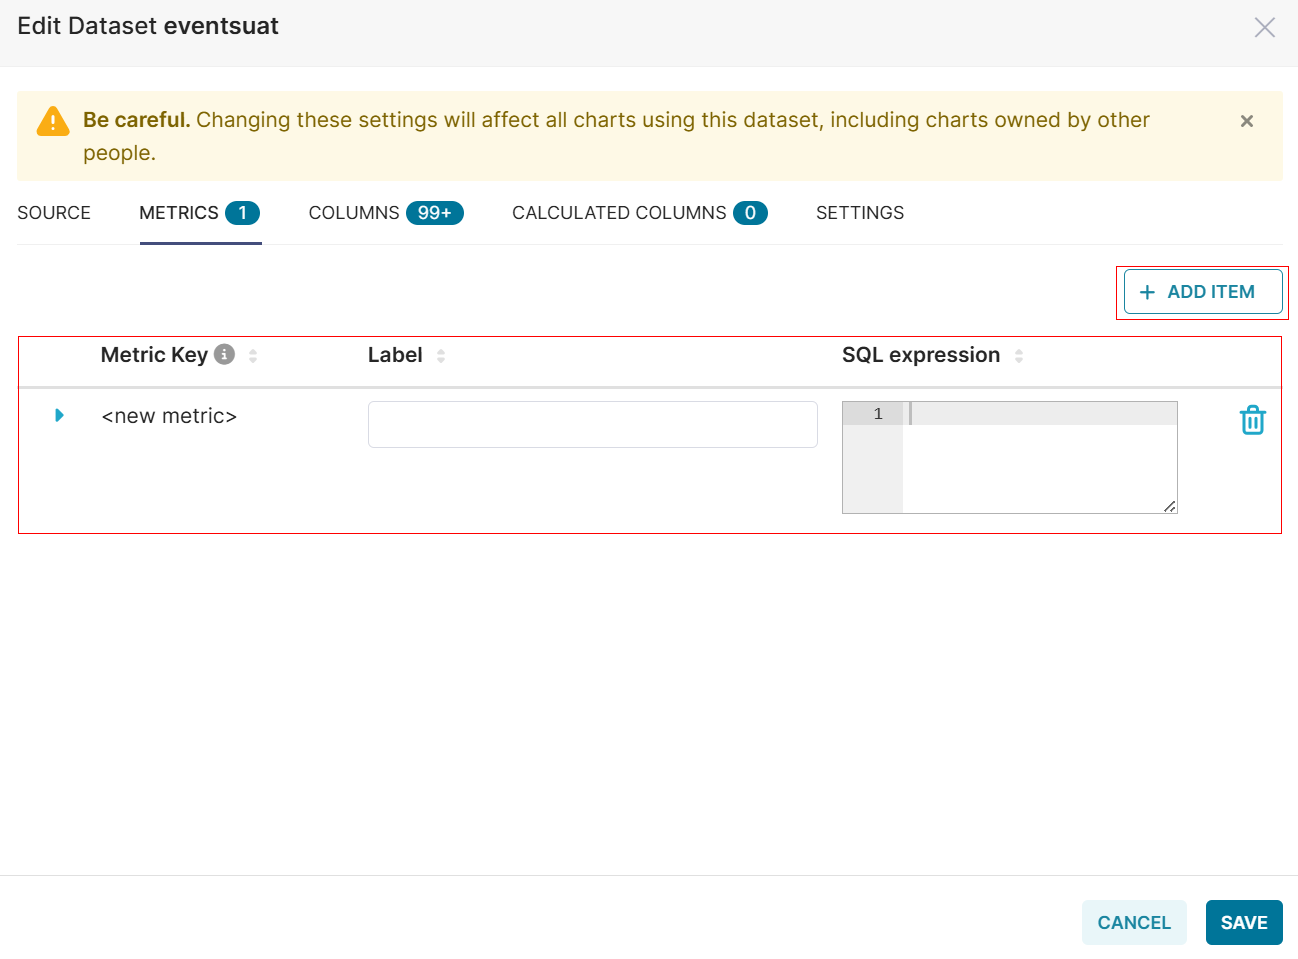
METRICS
- Click the METRICS tab to add Metric item.
- Click Add Item to add Metric item.
- Enter the Metric Key, Label, and SQL expression.
- Click the Delete icon to delete the added metrics.
- Click Save to save the added metrics. Otherwise, click Cancel to exit without saving.
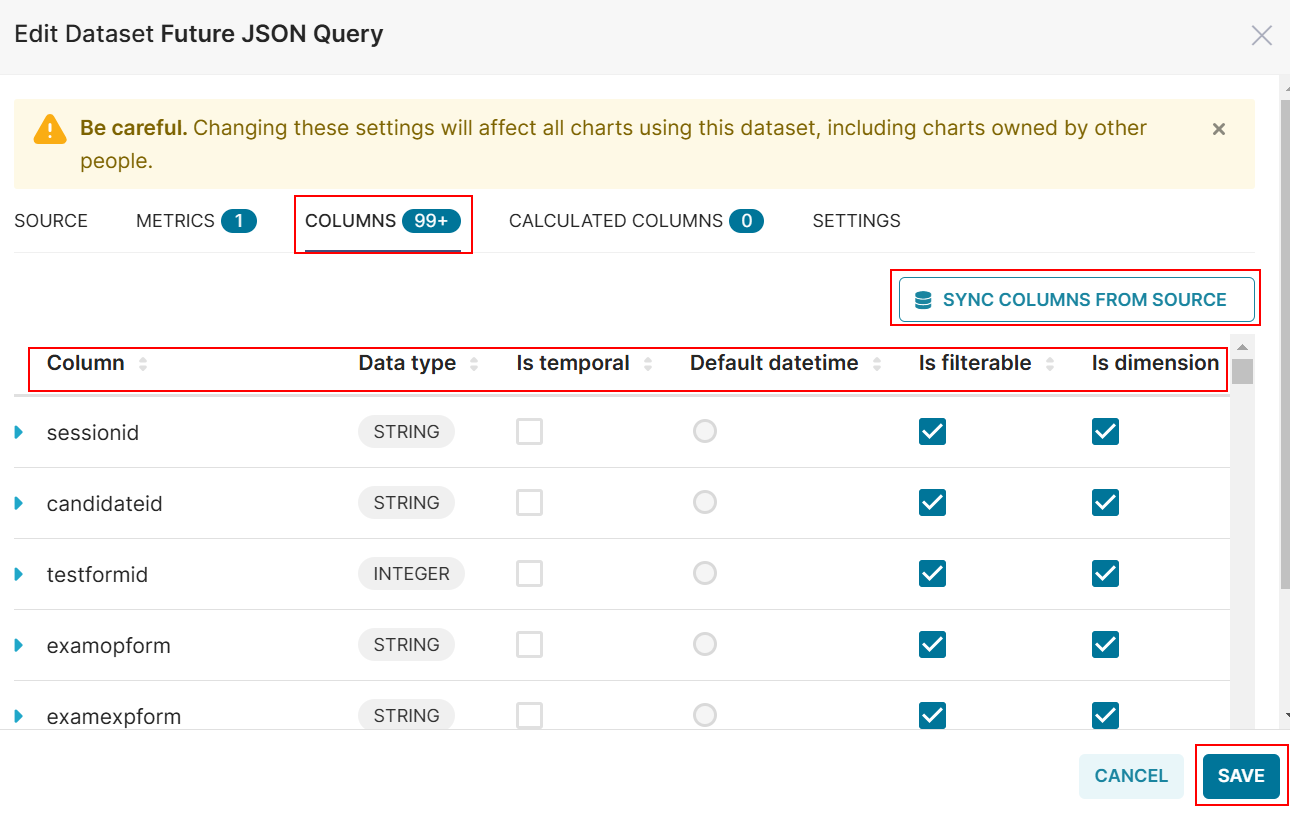
COLUMNS
- Click the Columns tab to view the columns list.
- Click Sync Columns From Source to synchronize all the columns from the data source.
- Search or filter the list with the following columns:
- Column: A single field or attribute in a database table.
- Data type: Defines the type of data (e.g., integer, string) a column can hold.
- Is temporal: Indicates if the data relates to time or changes over time.
- Default datetime: The default timestamp value assigned to a column if no other value is provided.
- Is filterable: Specifies whether the column can be used for filtering data in queries.
- Is dimension: Identifies if the column is an attribute used for categorizing or grouping data.
- Click Delete to delete the added column.
- Click Save to save the columns. Otherwise, click Cancel to exit without saving.
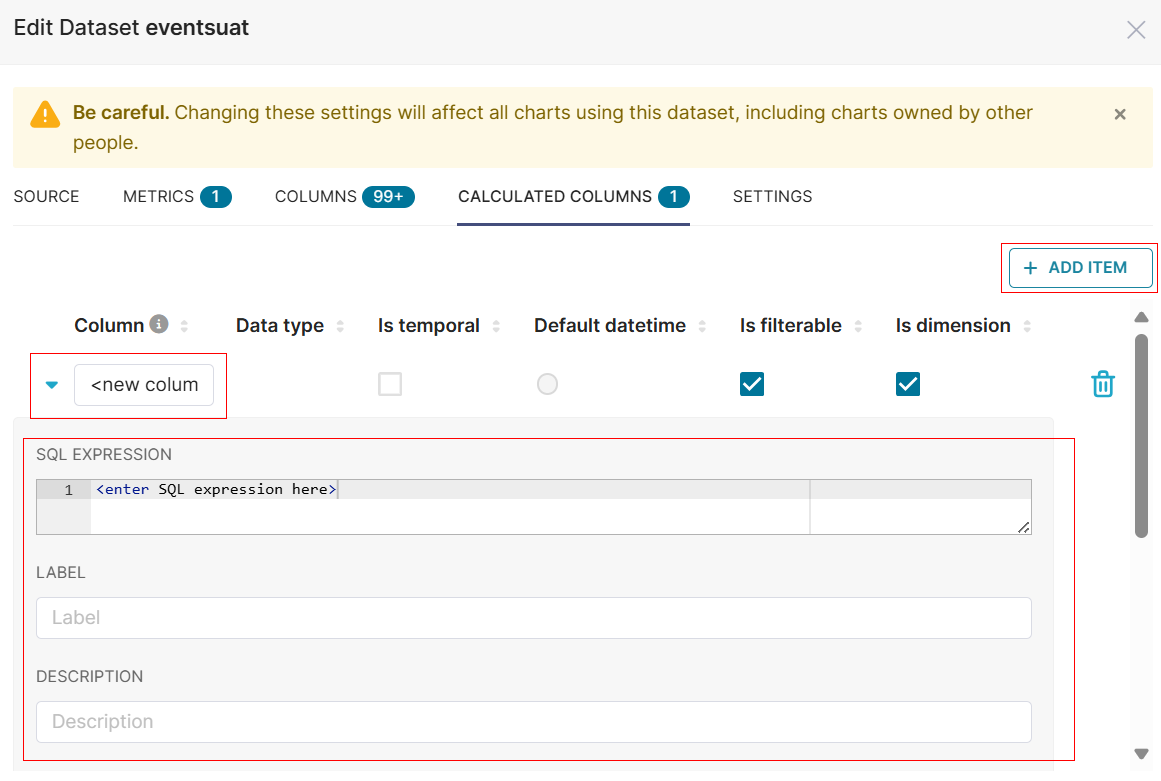
CALCULATED COLUMNS
- Click the Calculated Columns tab to view the calculated columns.
- Click Add Item to add new column items.
- Enter the Column Name, SQL Expression, Label, and Description.
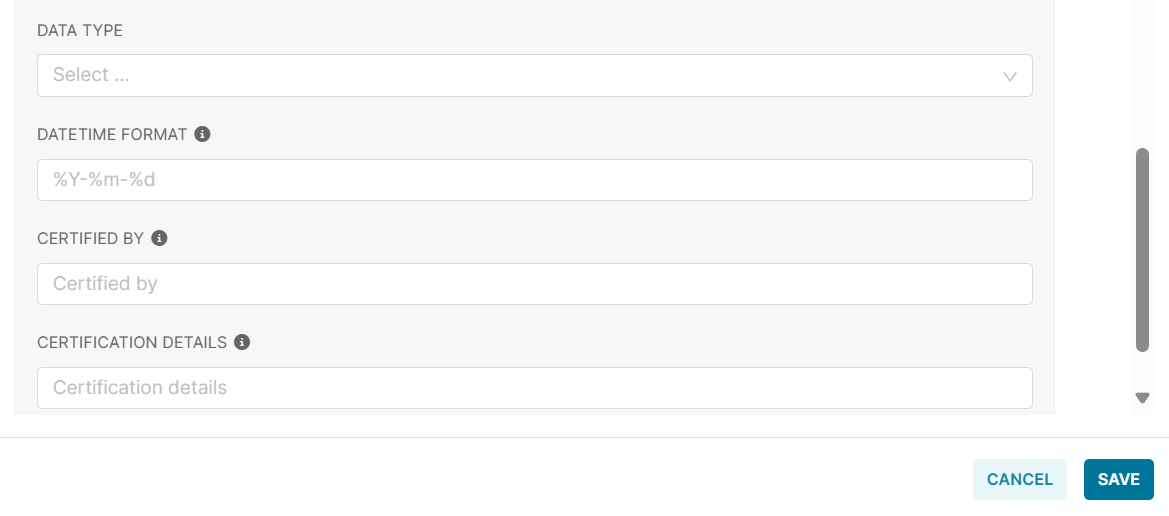
- Select the Data Type from the dropdown list.
- Enter the Datetime Format, Certified By, and Certification Details.
- Click +ADD ITEM to add more item columns.
- Click Save to save the item column. Otherwise, click Cancel to exit without saving.
Settings
- Click the Setting tab on edit dataset and select Basic or Advanced.
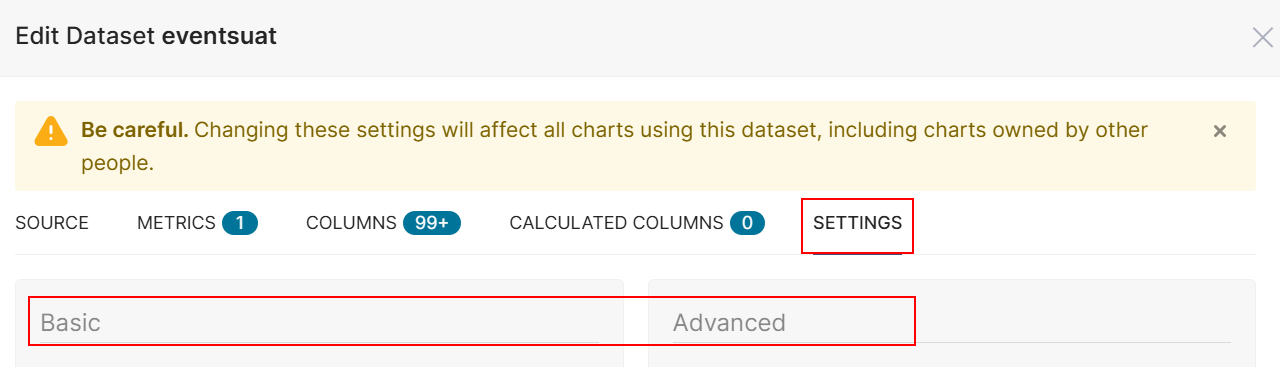
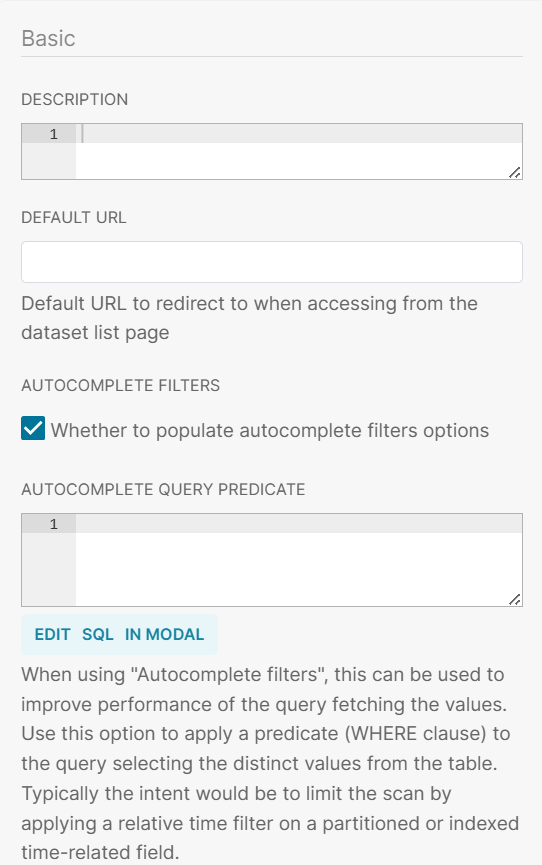
Basic:
- Enter the Description and Default URL to redirect to the dataset list page.
- Click the Autocomplete Filters checkbox to populate autocomplete filter options.
- Complete or enter the Autocomplete Query Predicate.
Note: When using "Autocomplete filters", this can be used to improve performance of the query fetching the values. Use this option to apply a predicate (WHERE clause) to the query selecting the distinct values from the table. Typically, the intent would be to limit the scan by applying a relative time filter on a partitioned or indexed time-related field.
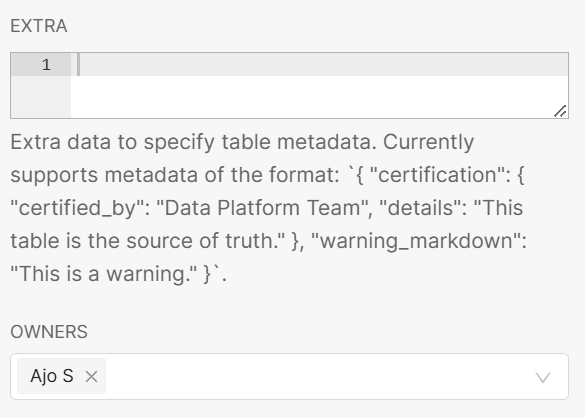
- Enter Extra data to specify table metadata. Supported metadata format: `{“certification": { "certified by": "Data Platform Team", "details": "This table is the source of truth." }, "warning markdown": "This is a warning." }`.
- Select the OWNERS from the dropdown list.
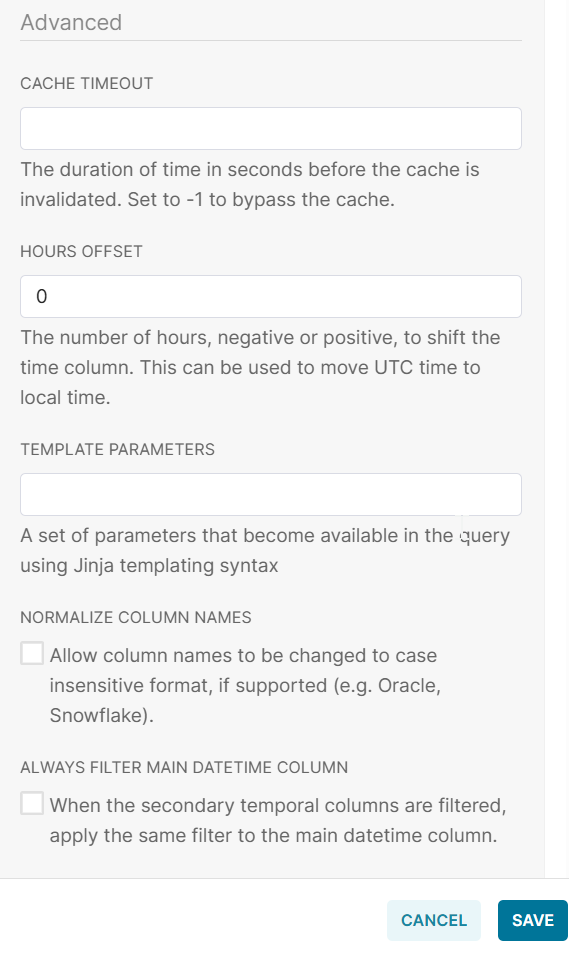
Advanced:
- Enter Cache Timeout, which is the duration of time in seconds before the cache is invalidated. Set to -1 to bypass the cache.
- Enter Hours Offset, which is the number of hours, negative or positive, to shift the time column. This can be used to move UTC time to local time.
- Enter Template Parameters to set parameters that become available in the query using Jinja templating syntax.
- Click the Normalize Column Names checkbox to allow column names to be changed to case insensitive format.
- Click the Always Filter Main Datetime Column checkbox to apply the same filter to the main datetime column.
- Click Save to save the dataset settings. Otherwise, click Cancel to exit without saving.
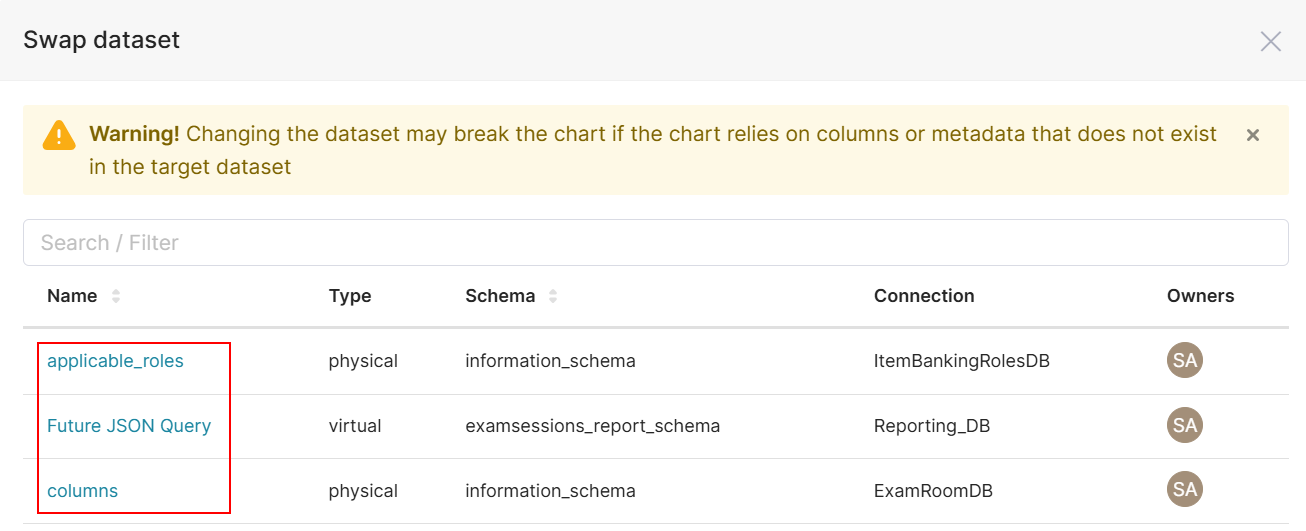
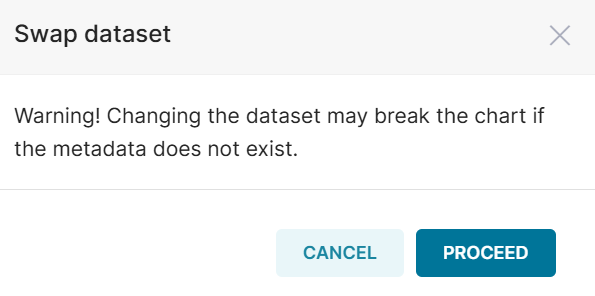
Swap Dataset
- Click Swap dataset from the Charts page to swap the dataset events.
- Under the Name column, click the hyperlink to swap the dataset.
- Click PROCEED to swap the dataset. Otherwise, click Cancel to exit without saving.
View in SQL Lab
To view the dataset in SQL Lab. For more information, refer to Section 3.1 SQL Lab.
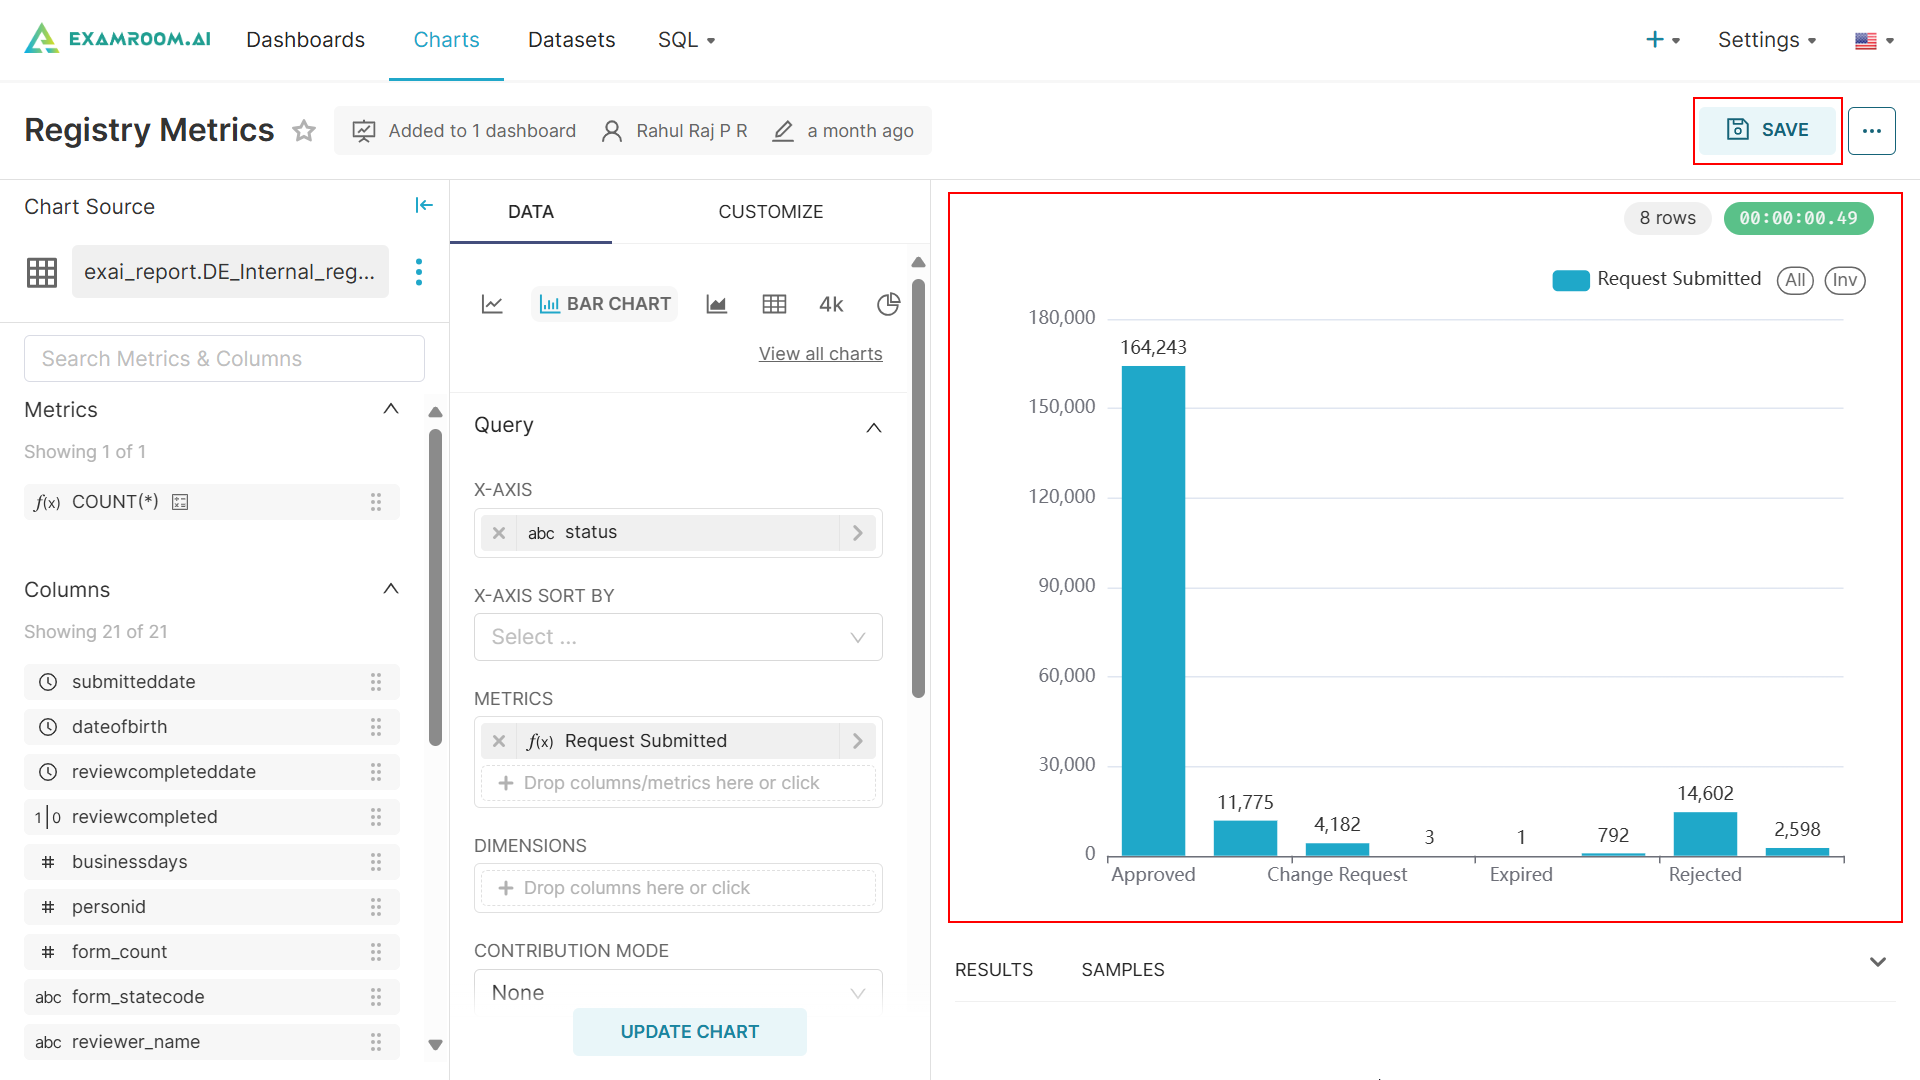
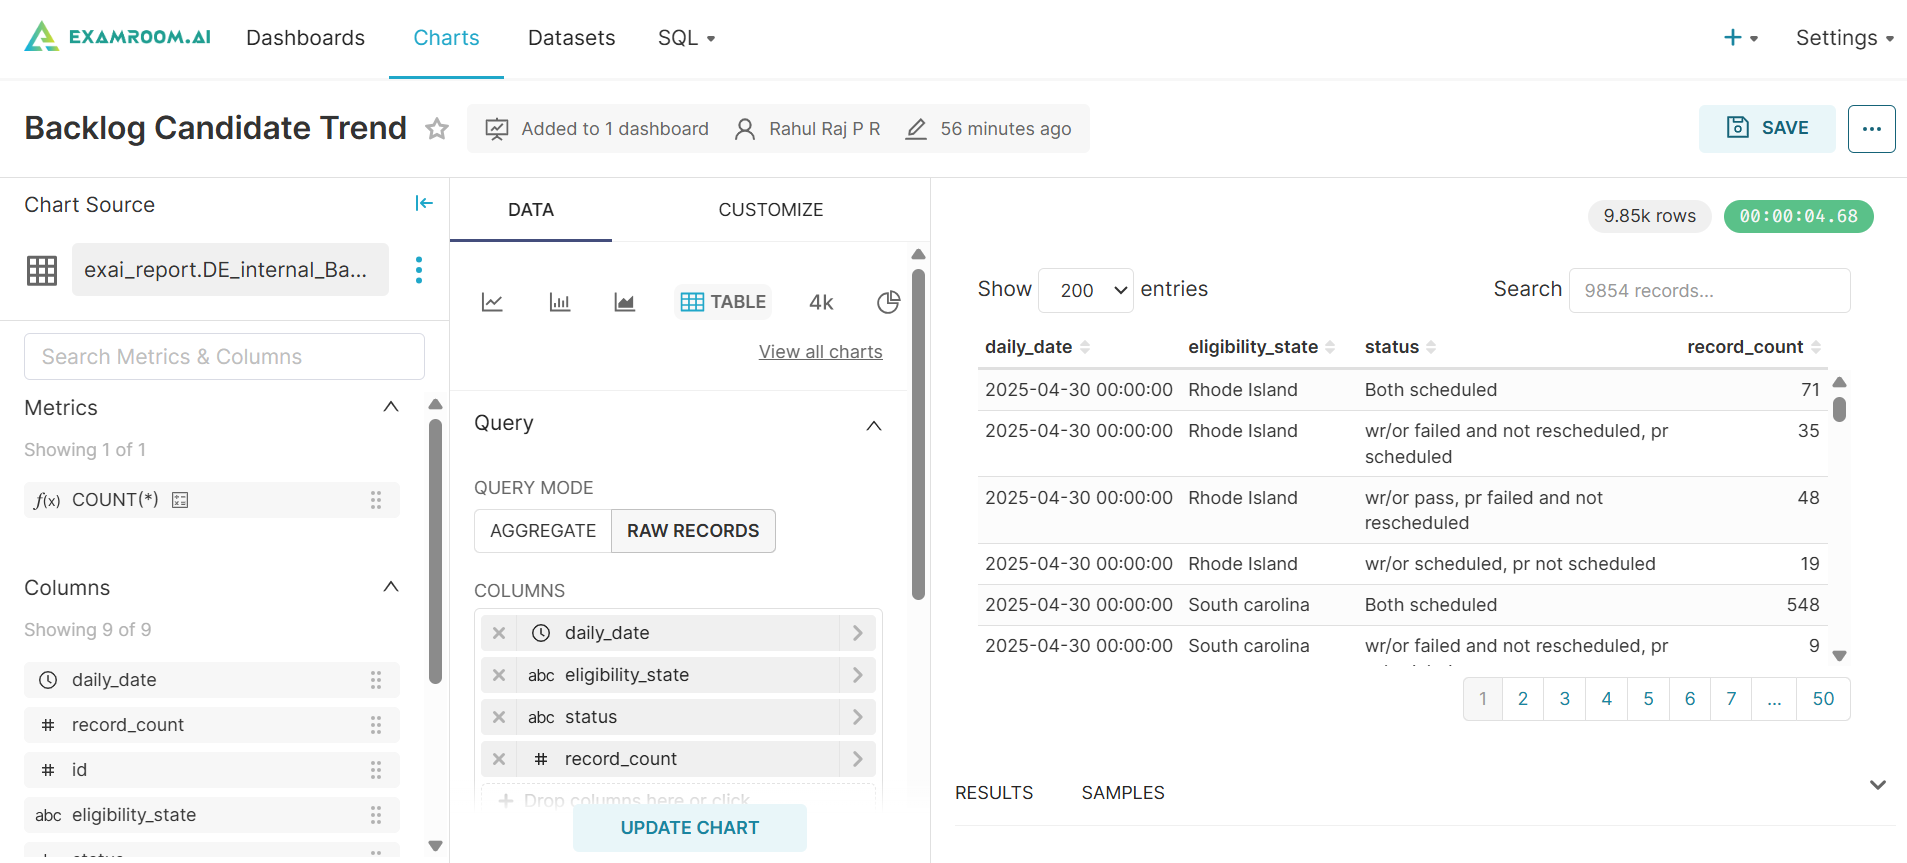
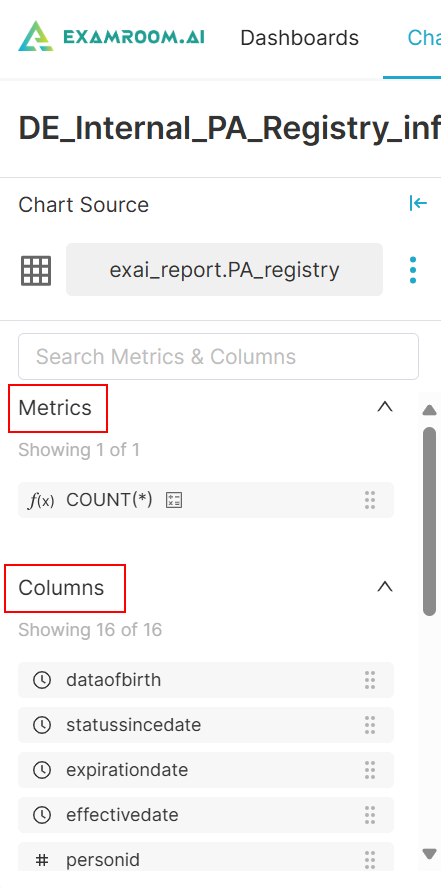
Manage Chart
- Click the Chart tab.
- In the Name column click the hyperlink to view the Chart section.
- View the Metrics and Columns of the Chart Source.
Add Data to update chart:
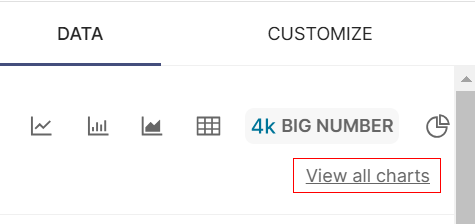
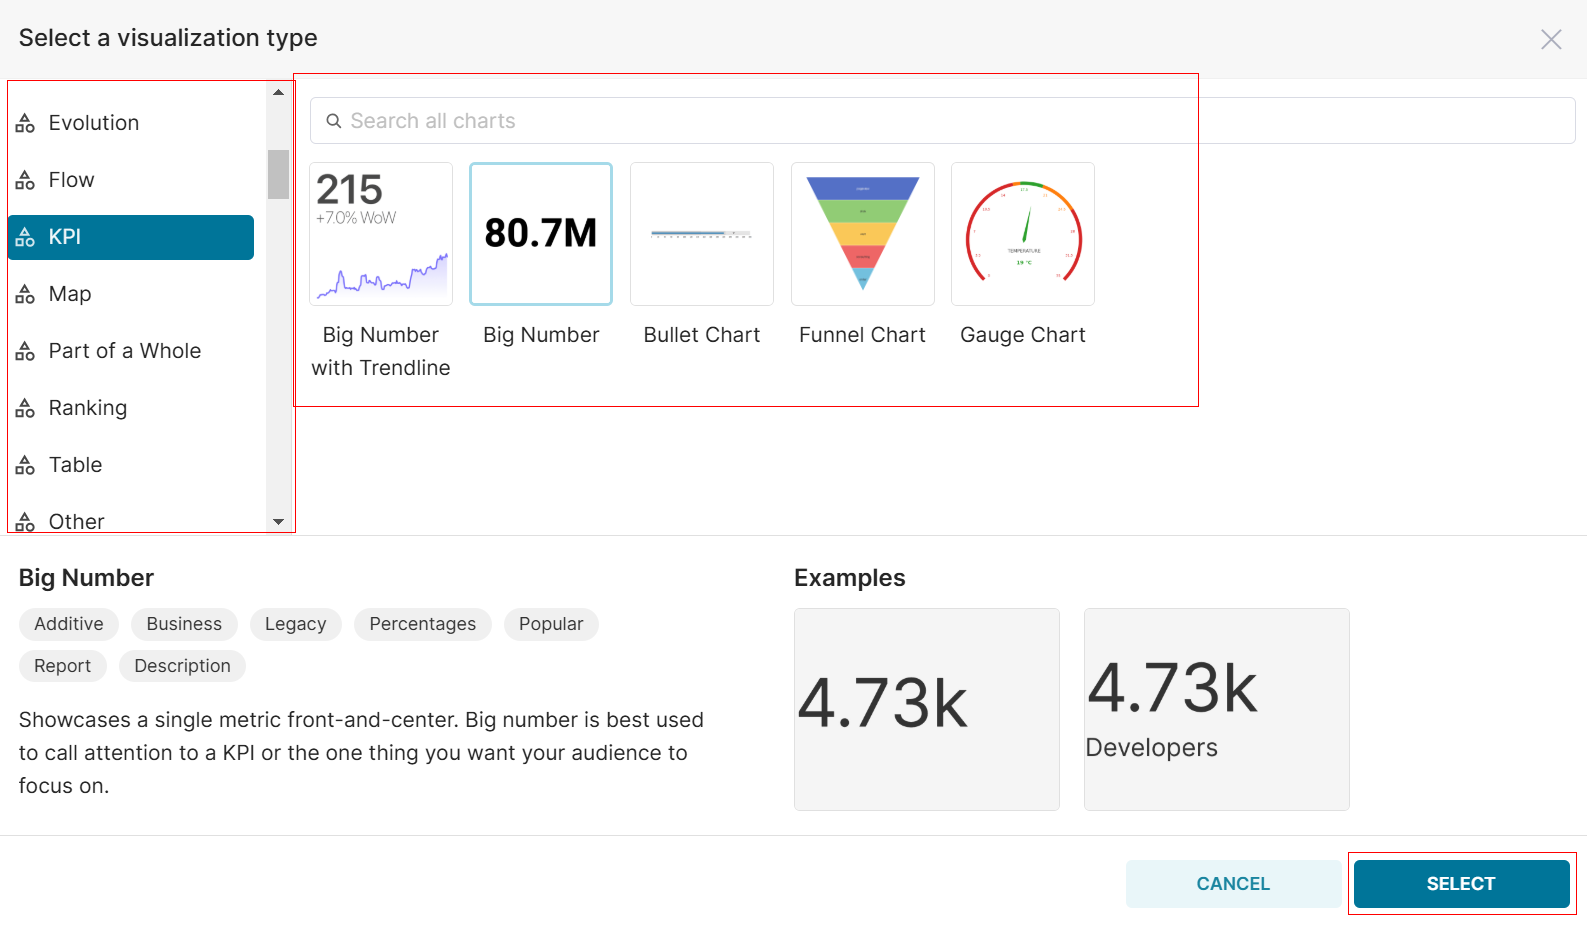
- Click View all charts to view all the charts.
- Use the filter on the left to refine the chart based on the requirements.
- Select the Chart from the list and click Select.
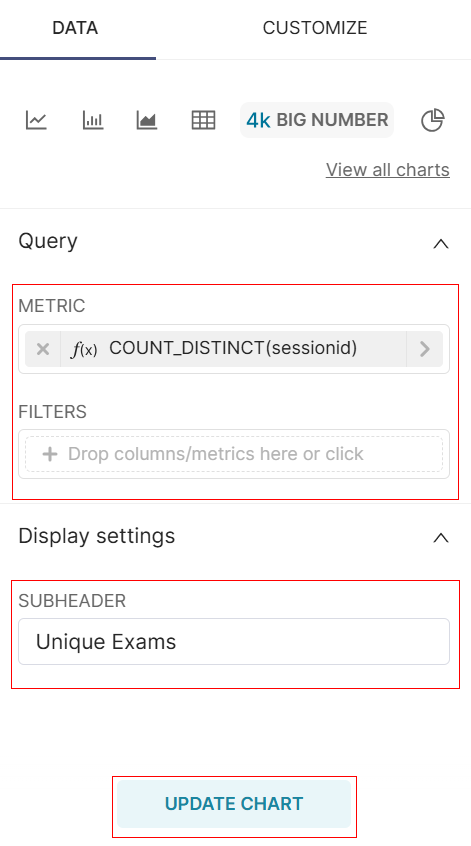
- Select the Metric and click or drag and drop the Filters in the Query section.
- Configure the Display Settings.
- Click Update Chart.
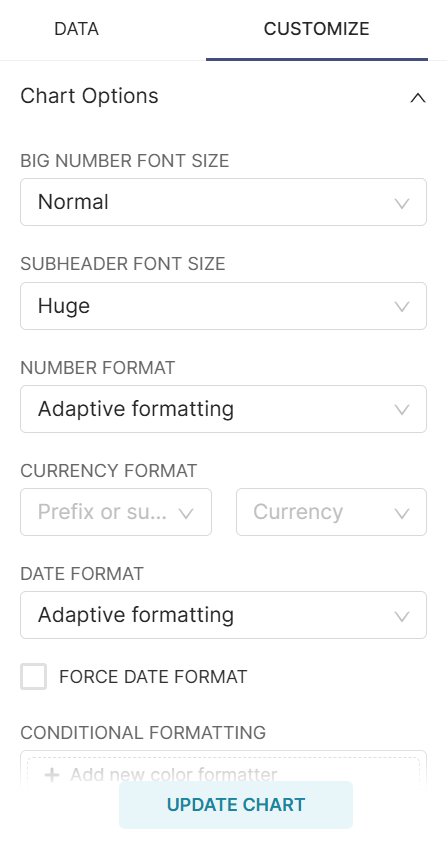
- Click the Customize tab to customize the chart.
- Select the chart options based on the selected chart.
- Click Update Chart to update the customization.
- Review the updated chart based on the request and changes.
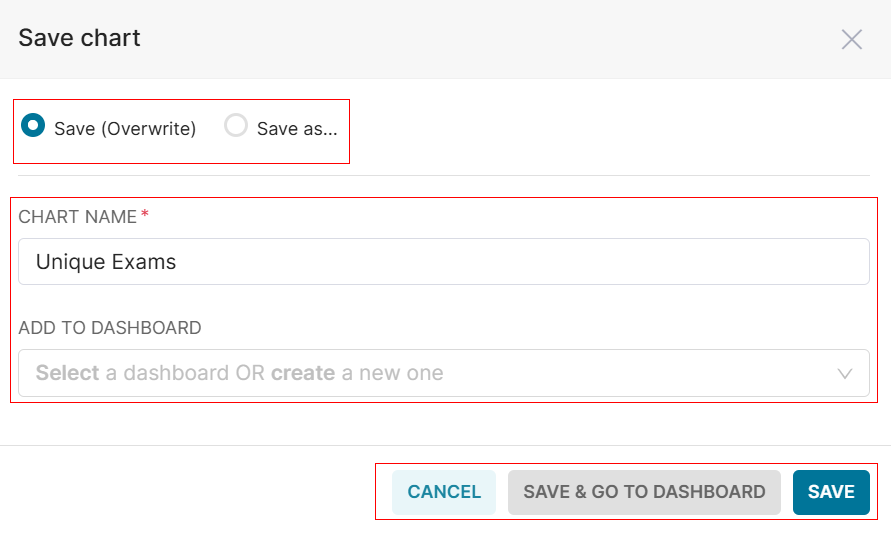
- Click Save to view the Save chart popup.
- Click the Save (Overwrite) or Save as options to save the chart.
Note: If Save (Overwrite) is selected, the existing chart will be replaced. If Save as is selected, a new chart will be created. - Enter the Chart Name and select the Dashboard from the list.
- Click SAVE to save the chart to the provided dashboard.
- Click Save & Go To Dashboard to save your chart and then navigate to the Dashboard to add or view the chart in your dashboard. Otherwise, click Cancel to exit without saving.