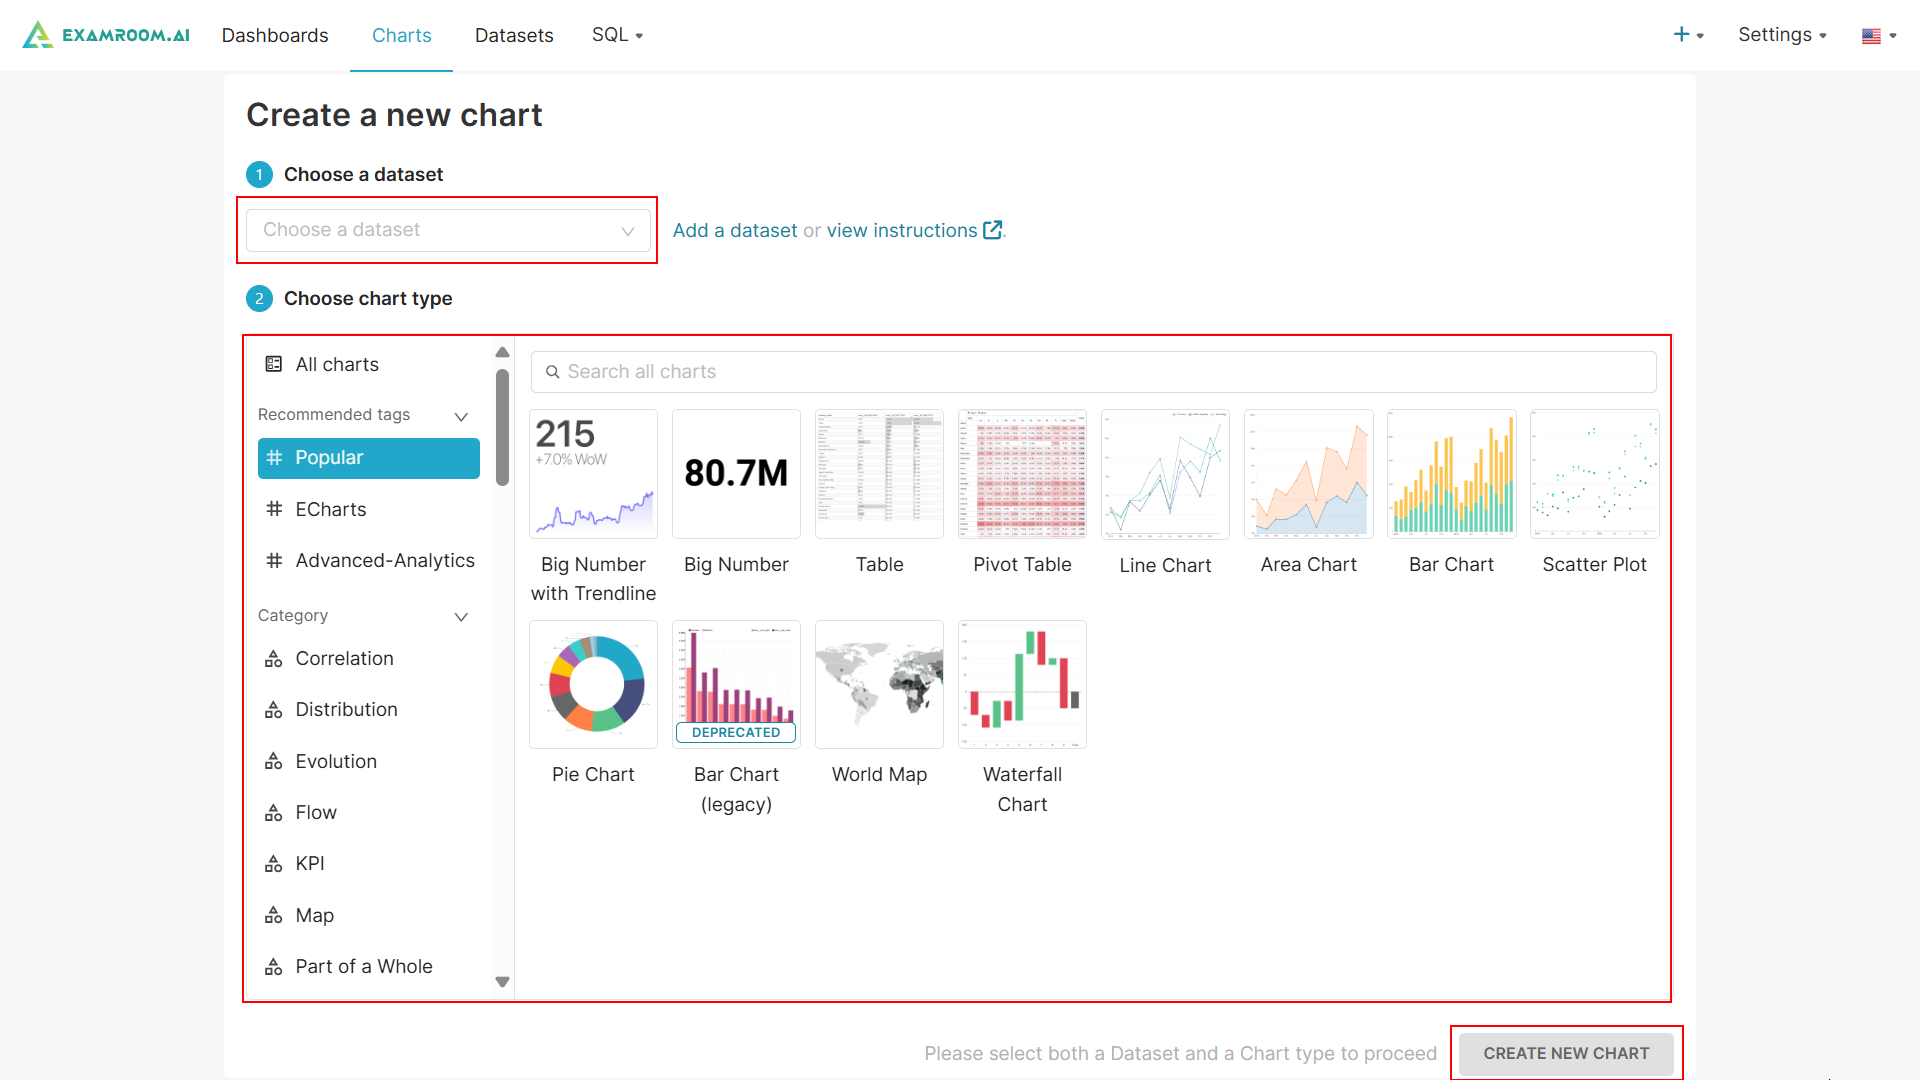
Add New Chart
- Click Charts on the toolbar.
- Click the +CHART button.
- To create a new chart, provide the following information.
- Choose a dataset from the dropdown list.
- Click Add a dataset to create a new dataset.
- Click view instructions to view the instructions to create a chart.
- Choose Chart type from the list.
Note: You can filter the charts using the recommended tags and categories or use the Search All Charts box to find the specific charts you need.
- Click Create New Chart to add a new chart. Enter a name for the chart and input the relevant chart details and values. For further instructions on managing charts, refer to, Section.1 View and Manage chart from step 4.
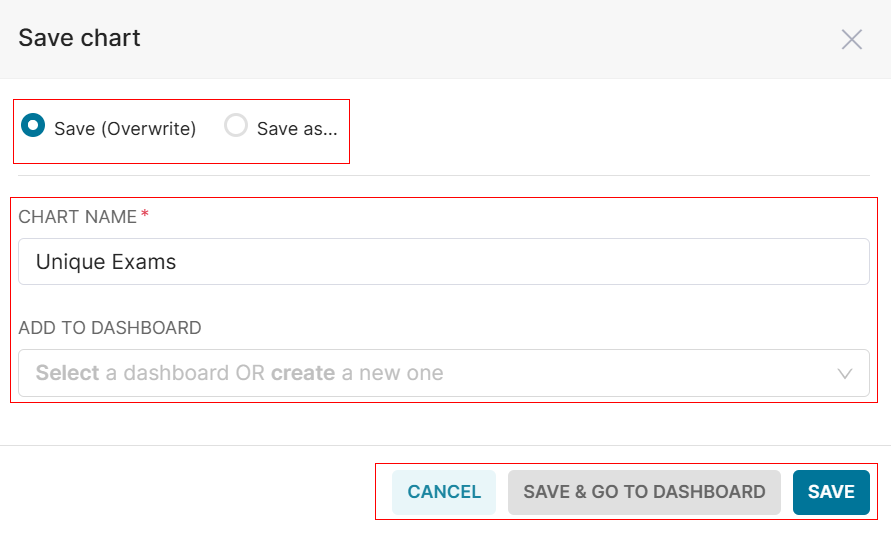
- Click Save to view the Save chart popup.
- Click the Save (Overwrite) or Save as options to save the chart.
Note: If Save (Overwrite) is selected, the existing chart will be replaced. If Save as is selected, a new chart will be created. - Enter the Chart Name and select the Dashboard from the list.
- Click SAVE to save the chart to the provided dashboard.
- Click Save & Go To Dashboard to save your chart and then navigate to the Dashboard to add or view the chart in your dashboard. Otherwise, click Cancel to exit without saving.