Exploring Program Summary
The Program Summary window displays the visualized summary of a specific program.
To view the summary, follow the steps below:
- Click Program Summary from the left side menu.
- The Program Summary includes the following information:
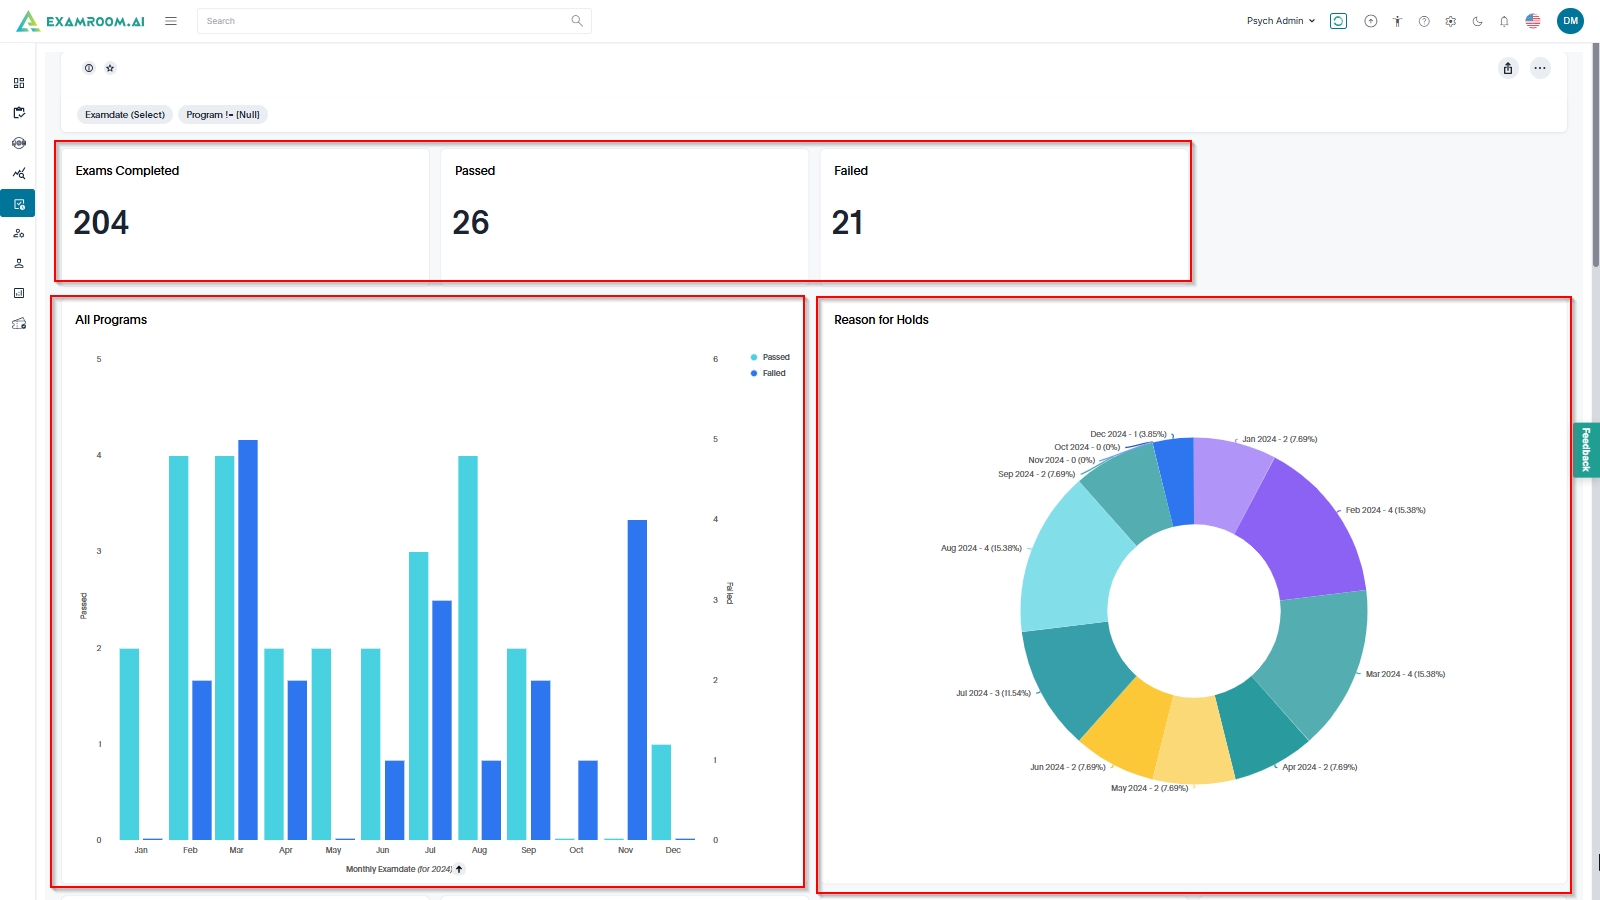
- Exam Completed: Displays the total number of completed exams.
- Passed: Shows the count of candidates who have successfully passed the exam.
- Failed: Indicates the number of candidates who did not pass the exam.
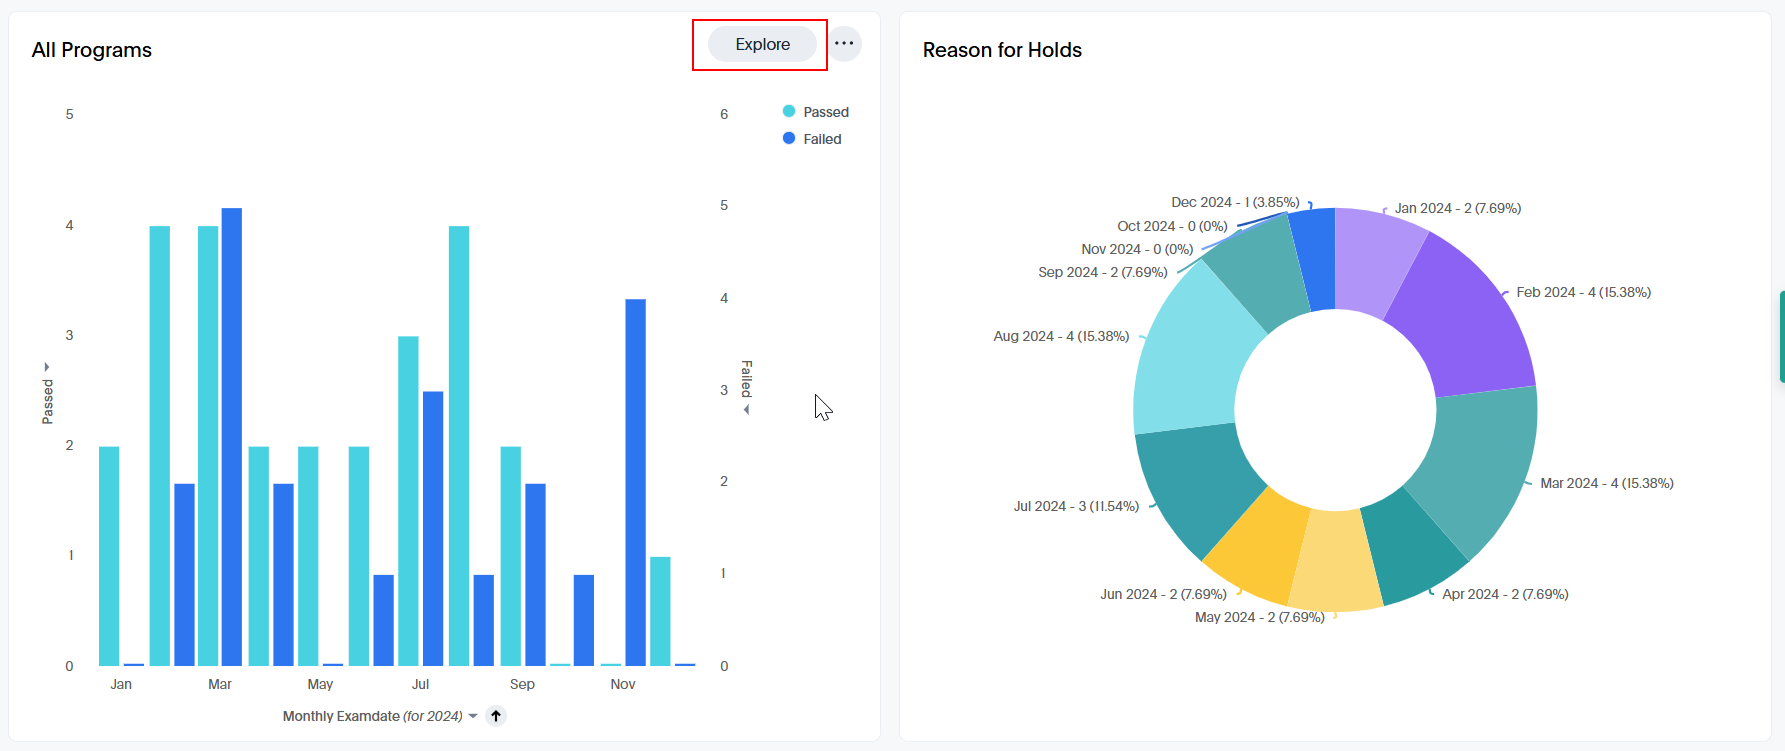
- All Program (Graph): A graphical representation of performance across different programs.
- Reason for Holds (Graph): A visual breakdown of the reasons why exams or results are on hold.
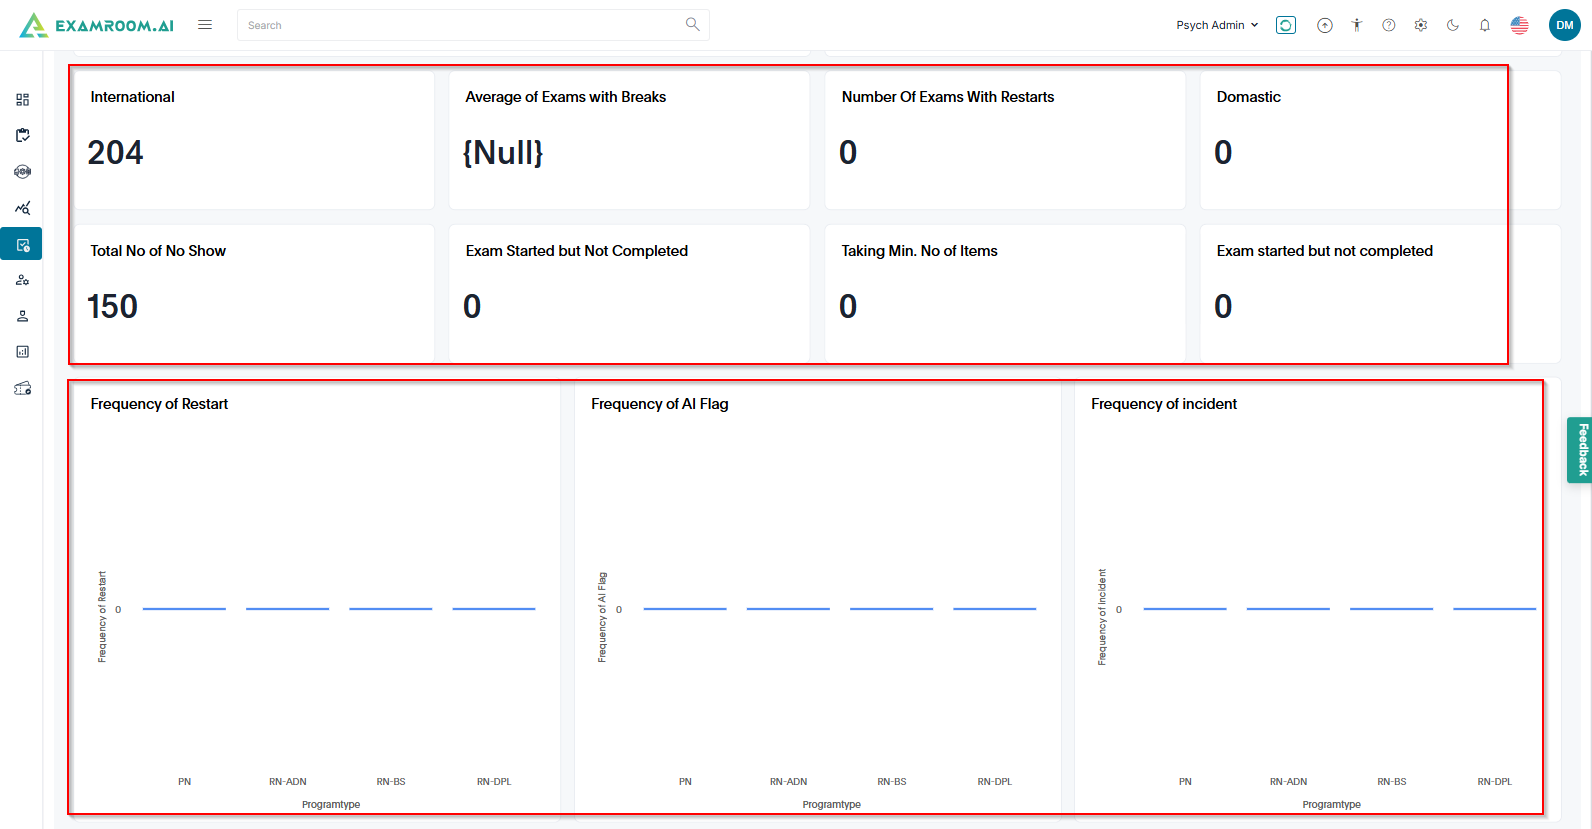
- International: Displays the count of international candidates who have taken the exam.
- Average Exams with Breaks: Shows the average number of exams where candidates have taken breaks during the test.
- Number of Exams With Restart: Represents the count of exams that were restarted due to any interruptions or technical issues.
- Domestic: Displays the number of exams taken by domestic candidates.
- Total No of No Show: Indicates the total number of candidates who registered but did not appear for the exam.
- Exam Started but Not Completed: Shows the count of exams that were initiated but not finished by the candidates.
- Taking Min. No of Items: Displays the number of candidates who completed only the minimum required number of items in the exam.
- Frequency: Represents the occurrence rate of specific exam events, such as no-shows, restarts, and breaks.
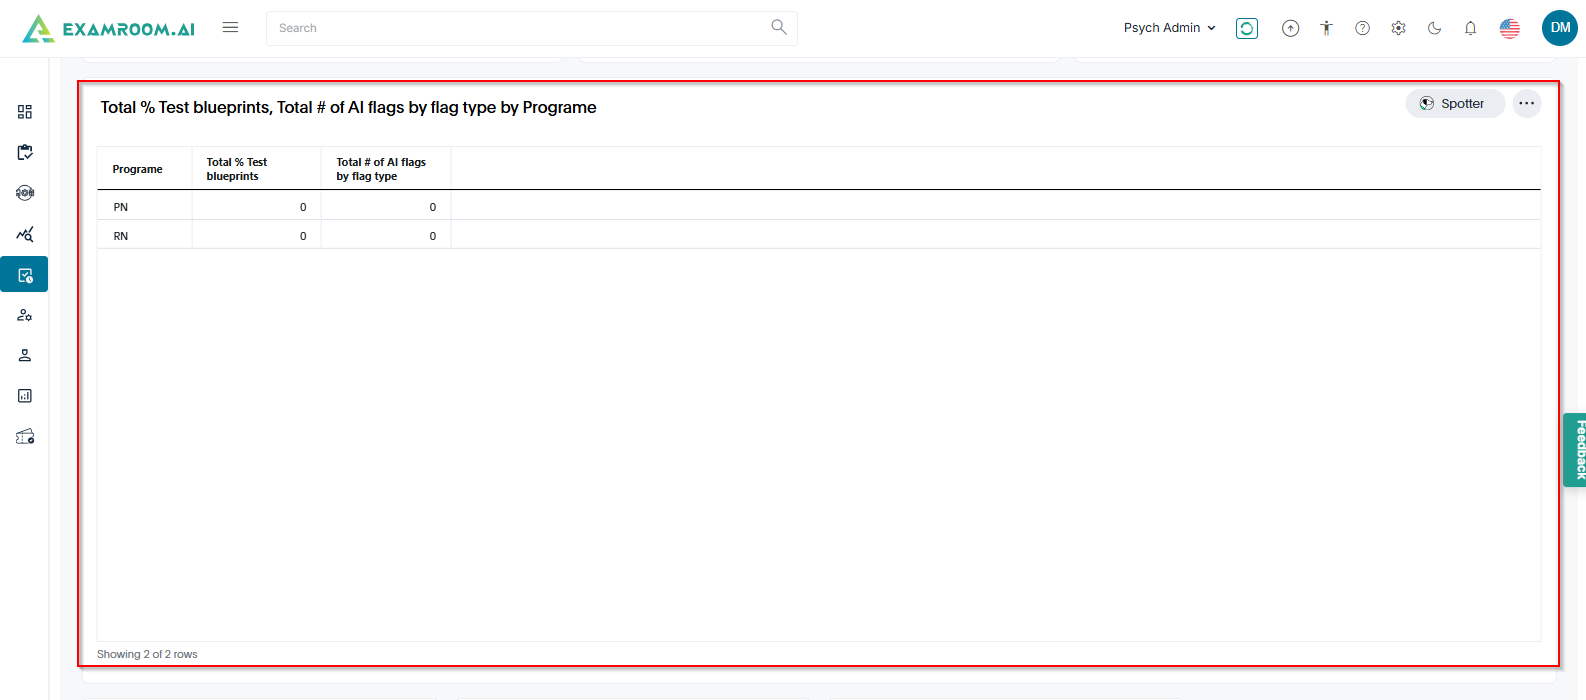
- Total % Test Blueprints: Displays the percentage distribution of test blueprints within the program.
- Total # of AI Flags by Flag Type by Program: Lists the number of AI-generated flags categorized by flag type for each program.
This section helps in analyzing test structure, AI-detected anomalies, and overall program performance.
- On the program summary click:
Liveboard Details to view detailed insights and analytics.
Add to Favorite to save the summary for quick access.
Share to share the report with the specific group or user.
Ellipses to view the more options available.
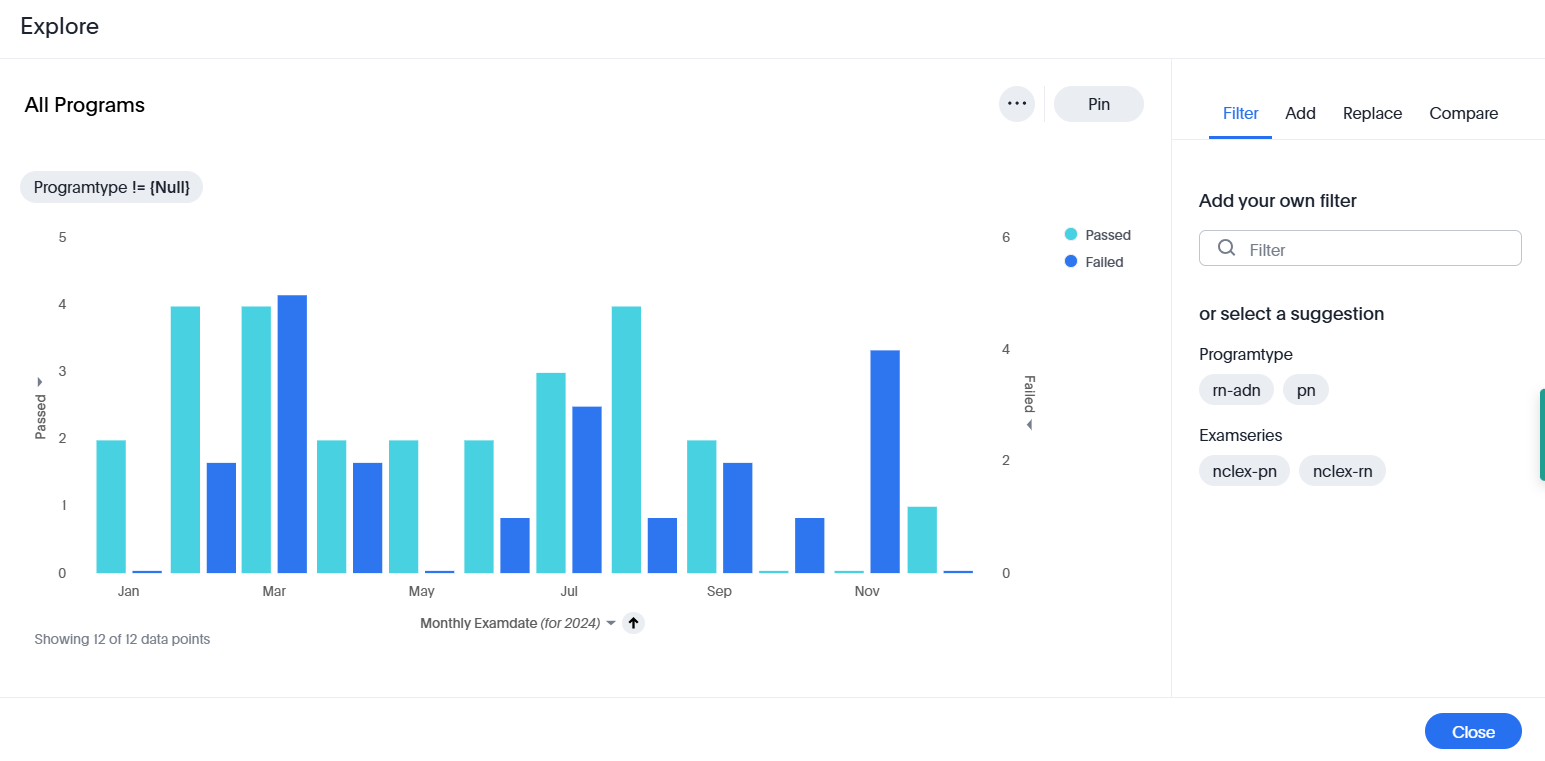
- Click Explore to explore and customize the report based on the requirements.

On the Program Summary page, you can explore within all the charts to customize the chart view.
To explore a chart, follow the steps below:
- Click Explore in a specific chart.
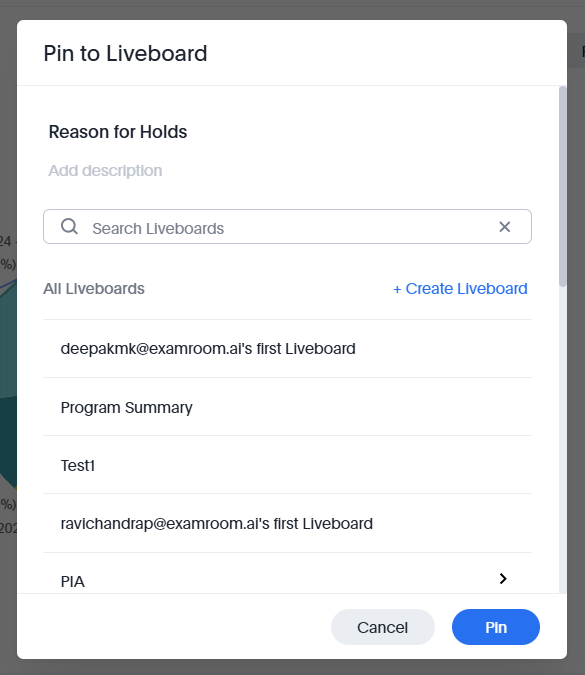
- Click Pin to add the report to the Liveboard. For more information, click Adding the Report to Liveboard.
- From the right-side menu of the Explore window, you can Filter, Add, Replace, and Compare:
- Filter: Customize the summary chart by applying filters and viewing data based on selected criteria.
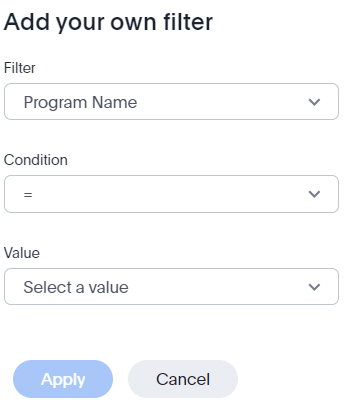
To add filters to the summary chart, follow the steps below:- Enter the keyword in the Filter Search box and choose an option from the dropdown list.
- Select the Condition and Value from the dropdown list.
- Click Apply. Otherwise, click Cancel to exit without saving.
- Enter the keyword in the Filter Search box and choose an option from the dropdown list.
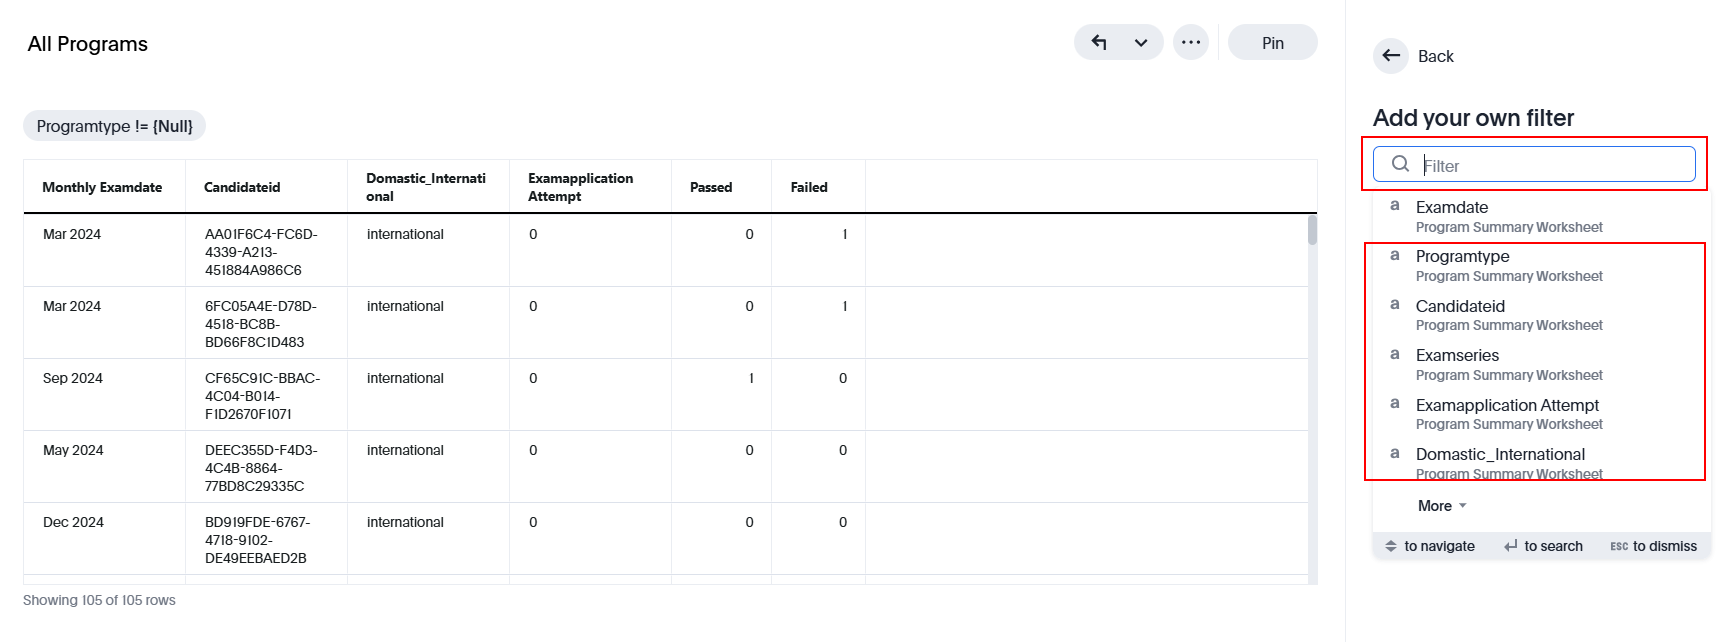
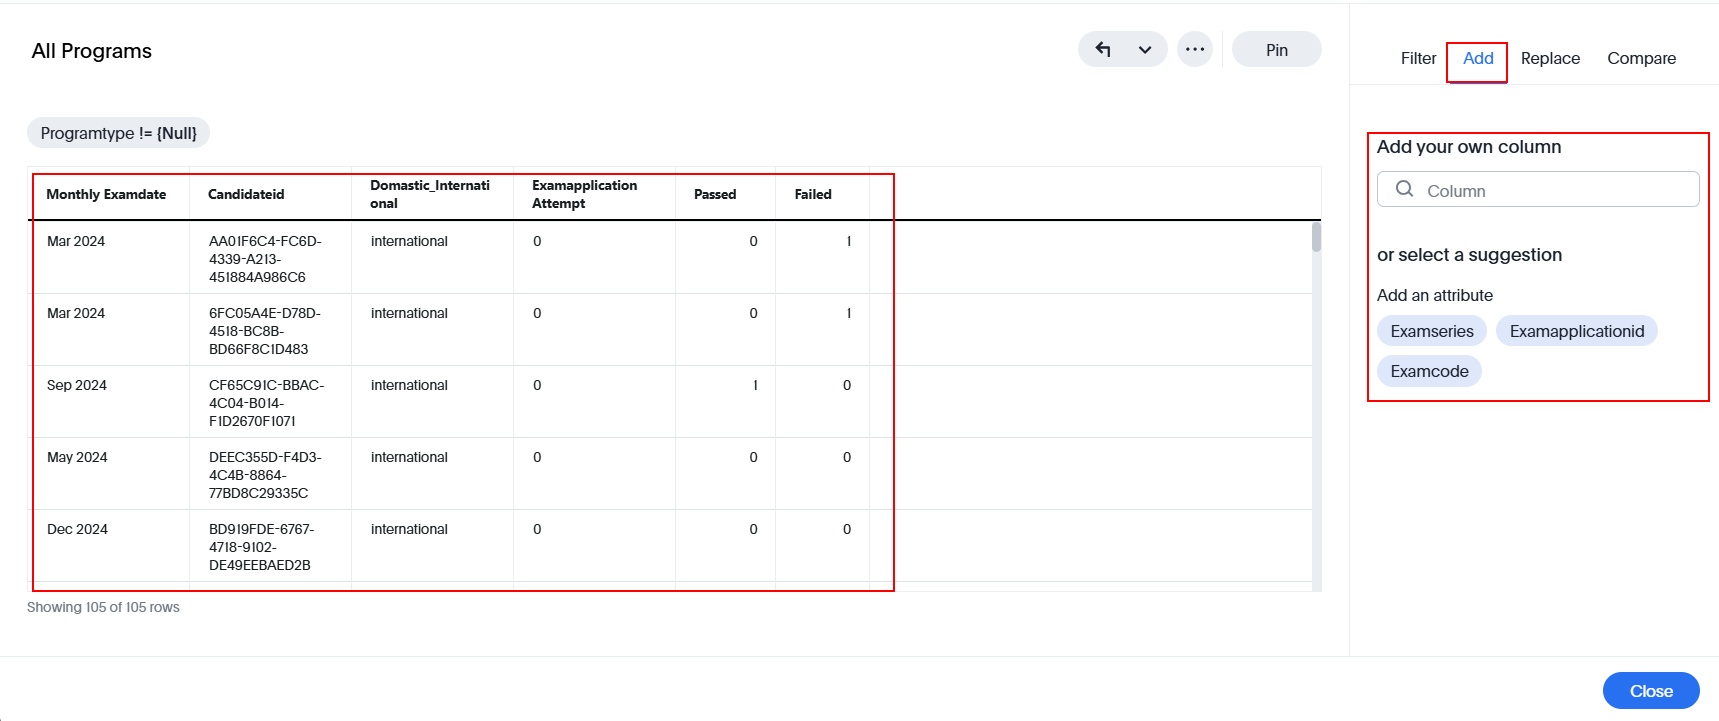
- Add: Add a column.
- Select the desired column from the dropdown menu by searching and choosing from the available list.
- View the selected column in a table format.
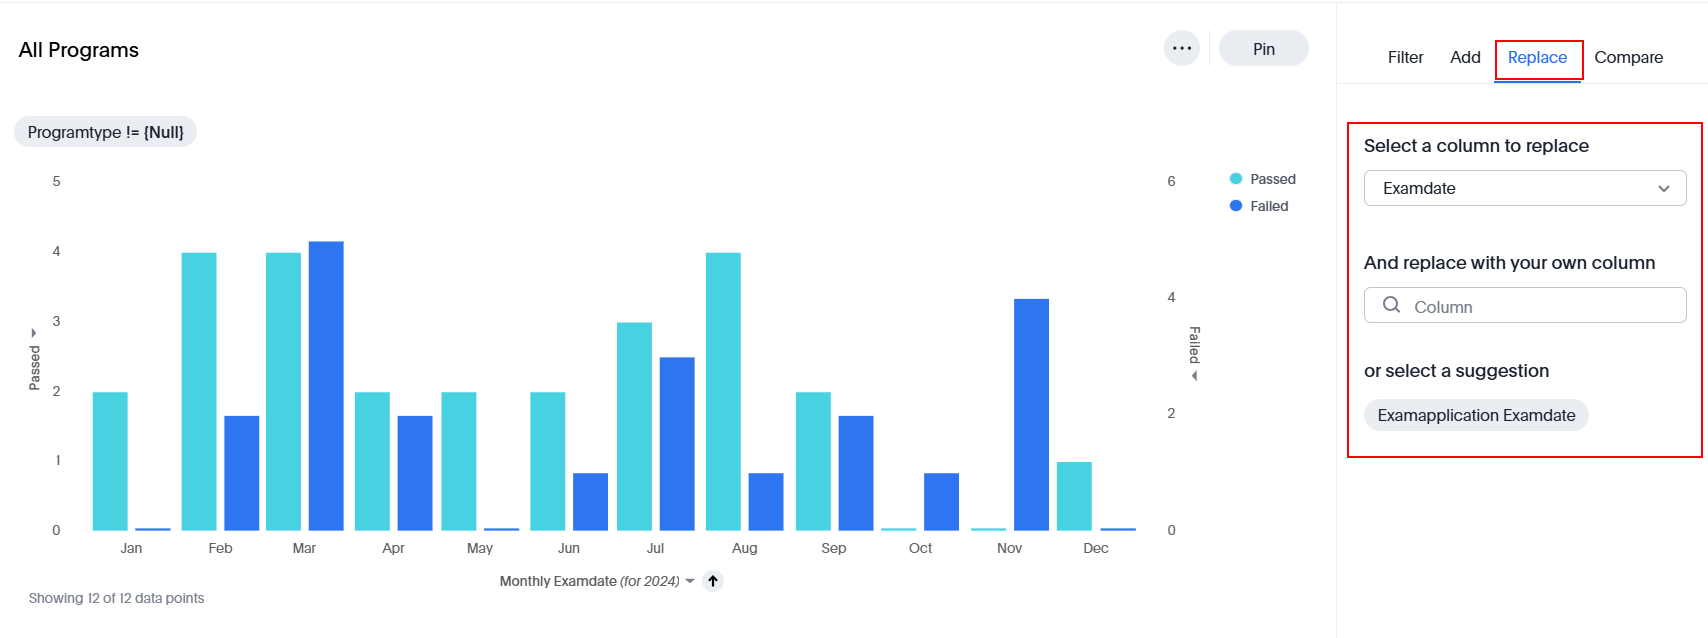
- Replace: Replace the existing column with your own column.
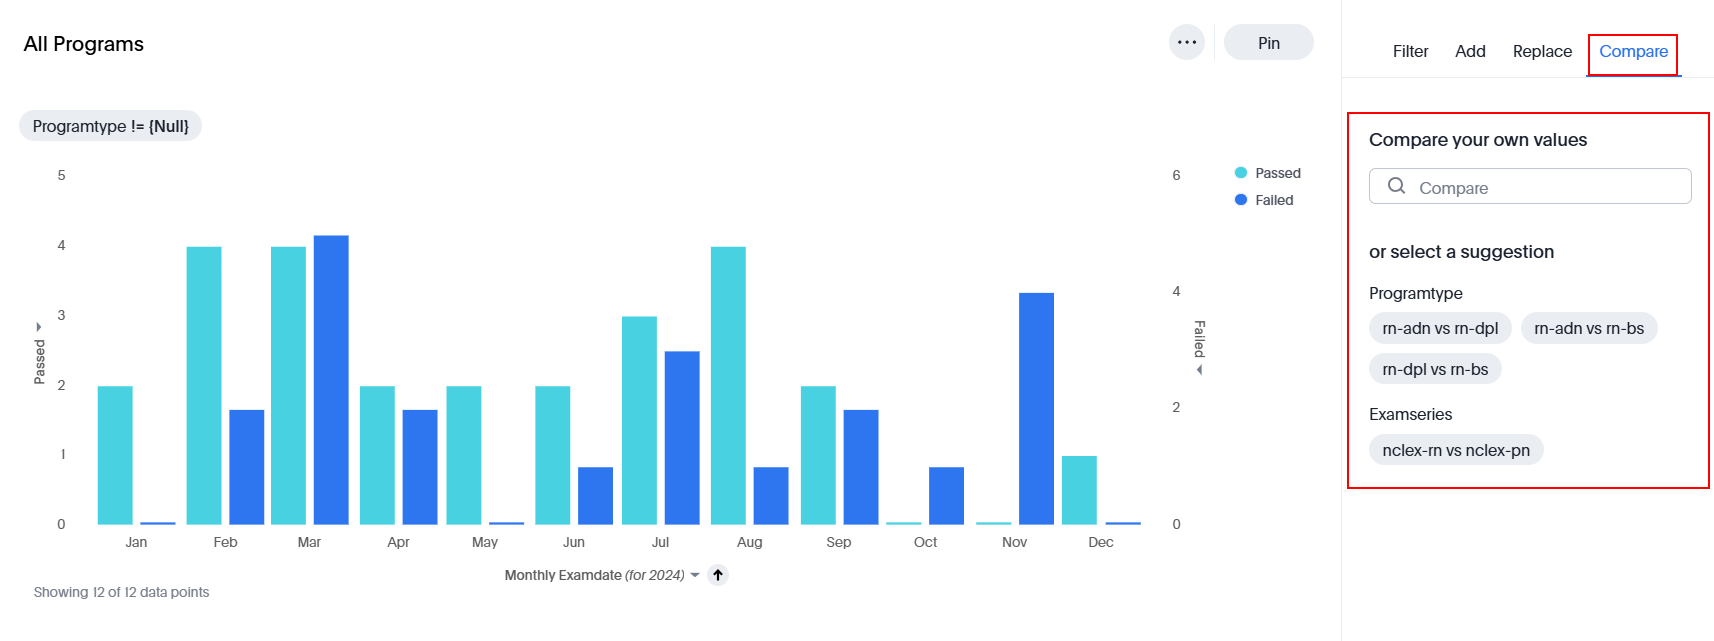
- Compare: Compare your own values with the existing column.
- Filter: Customize the summary chart by applying filters and viewing data based on selected criteria.
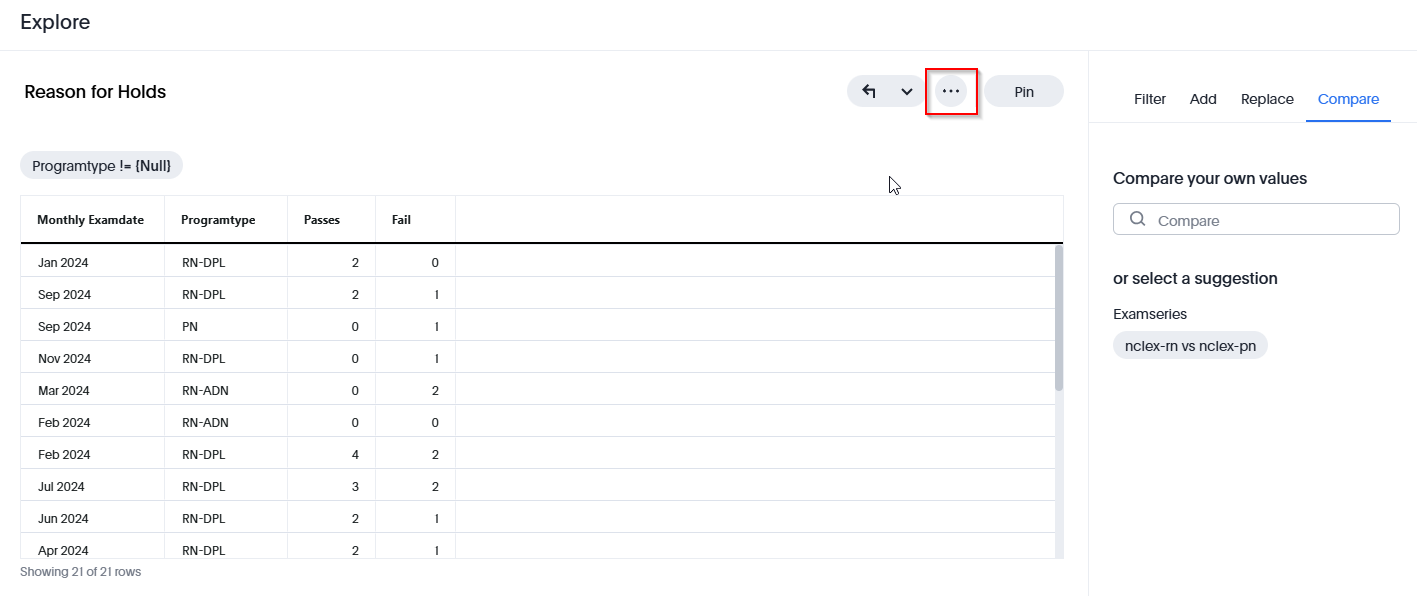
- Click
Ellipses to view the below options:
- Show Underlying Data: Displays the raw data behind a visualization or chart, allowing users to analyse detailed records and values.
- Download: Enables users to export data or visualizations in various formats (e.g., CSV, Excel, or image) for offline use and further analysis.
- SpotIQ Analyze: A smart analytics tool that automatically generates insights, trends, and patterns from data using AI-driven analysis.
- Sync to Sheets: Allows seamless integration with spreadsheet applications (e.g., Google Sheets) to sync and update data in real-time.
- Sync to Other Apps: Facilitates data synchronization with external applications and tools for enhanced reporting and collaboration.
- Manage Pipelines: Provides options to configure, schedule, and automate data pipelines for continuous data processing and updates.